Case Study
Redefining Efficiency and Sustainability for the Energy Industry
In response to the growing economic challenges faced by the energy industry in a post-COVID era, I led the design effort at enSift as we looked to redefine operational efficiency and profitability. The existing manual processes for tracking work, ensuring compliance, and minimizing liability were no longer viable in an industry grappling with new policies, regulations, and the pressing need for sustainable practices.
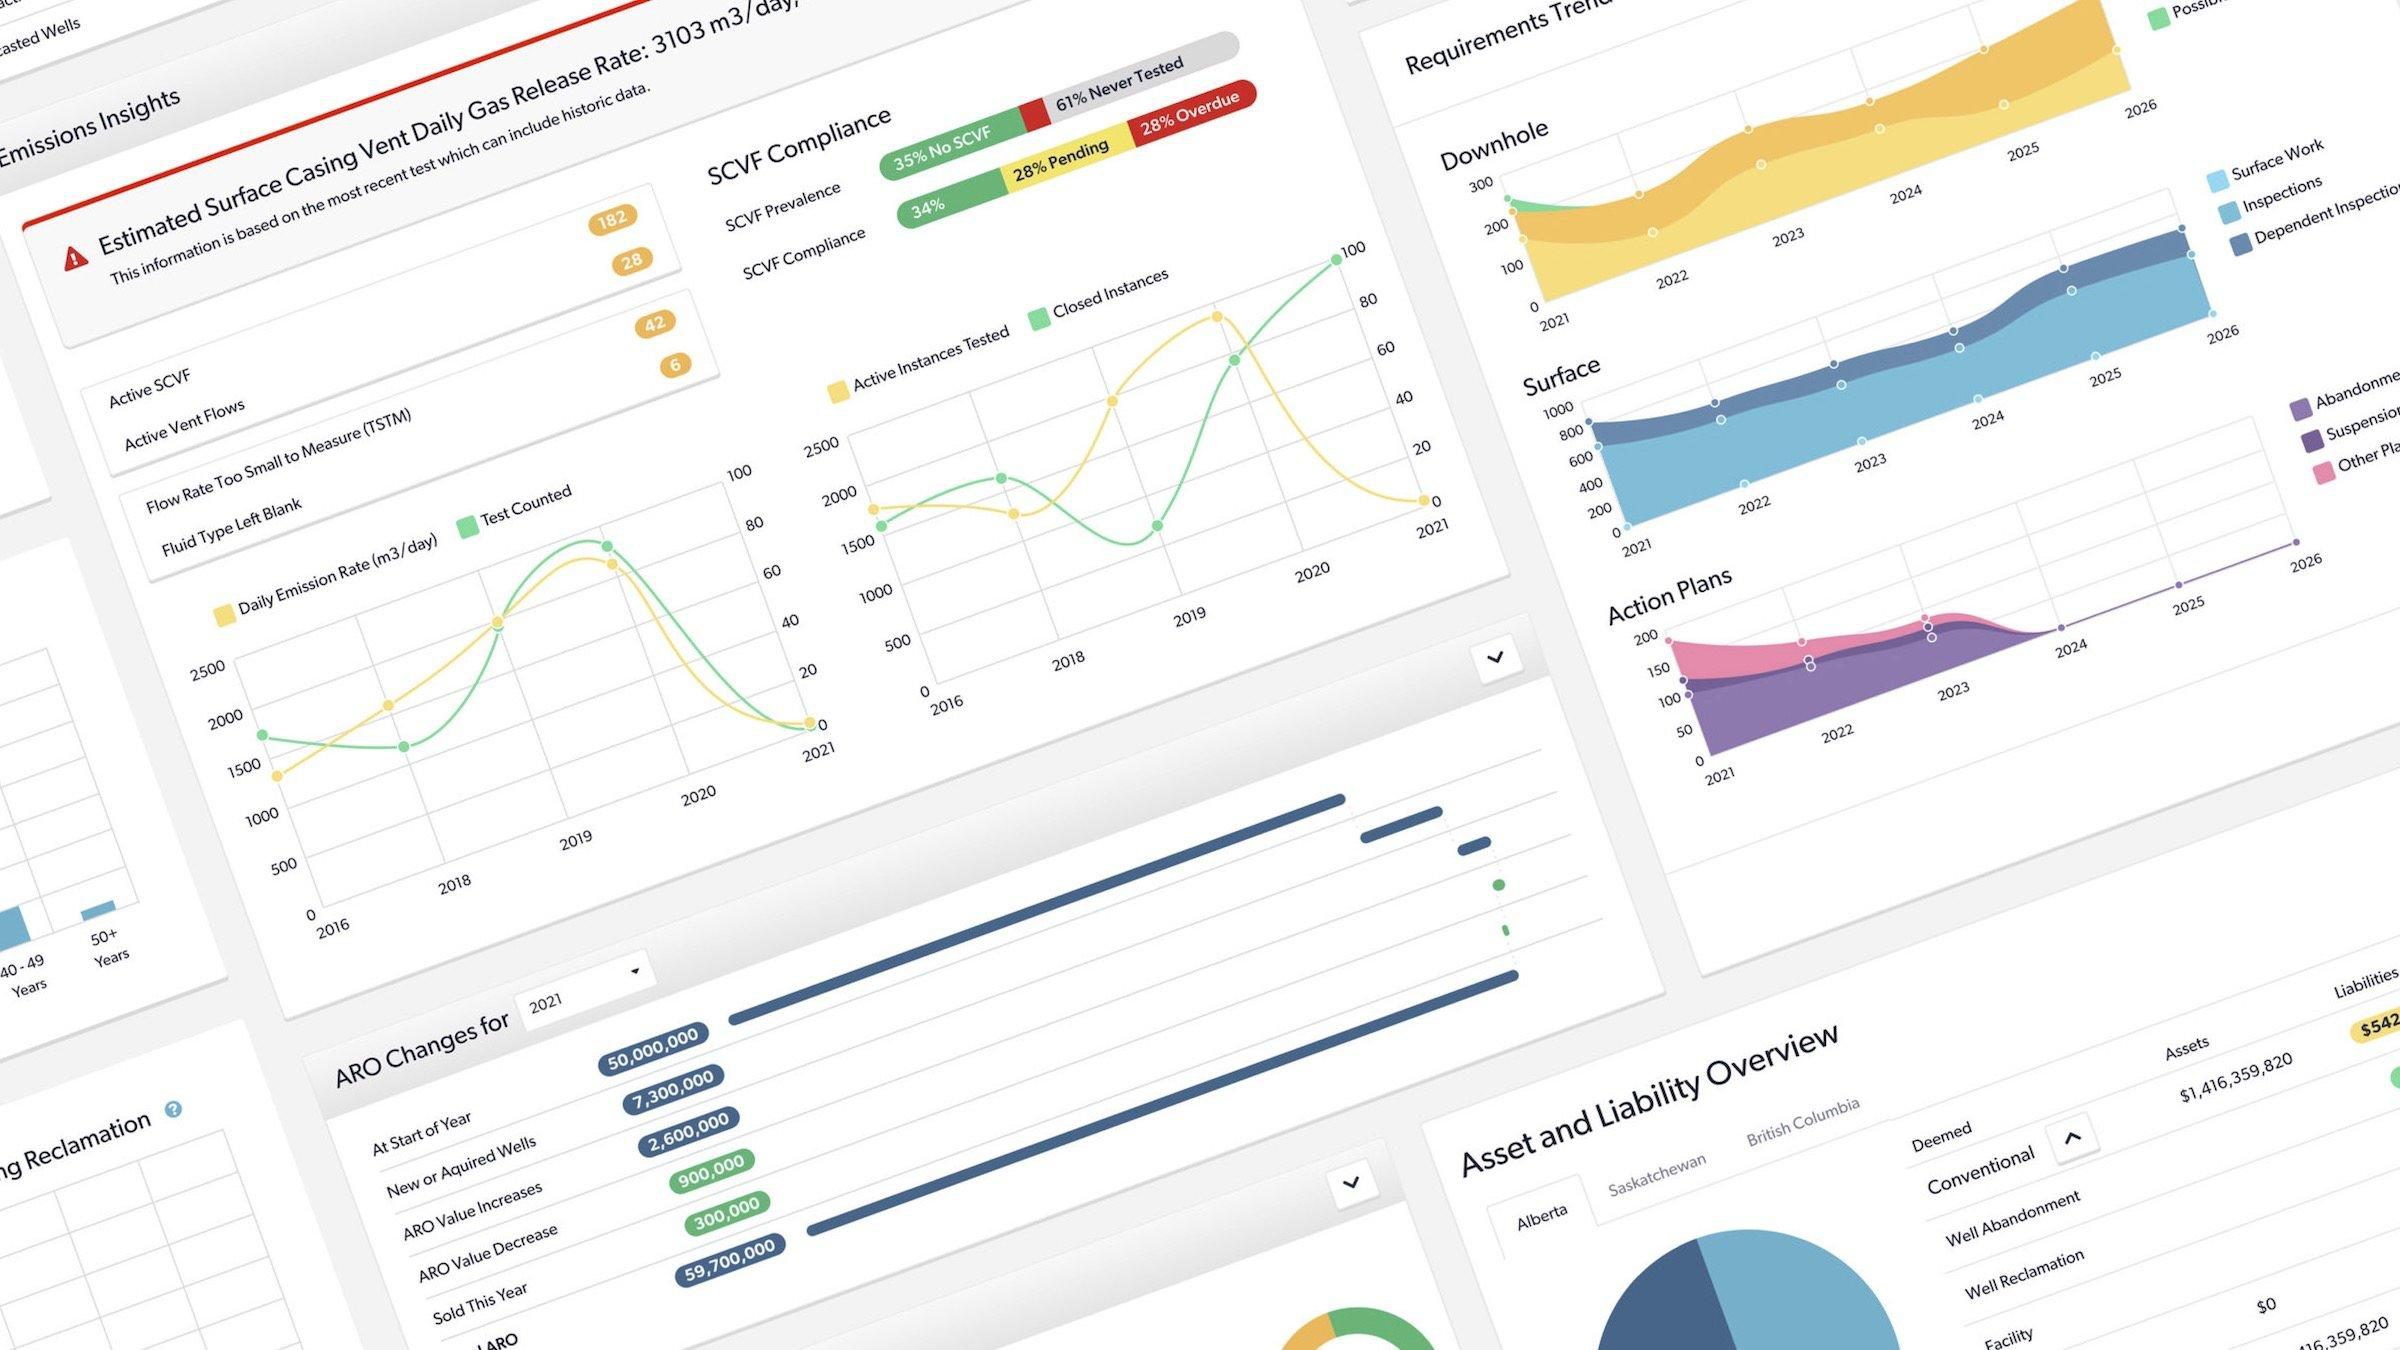
This case study delves into our iterative approach to addressing these issues through design, focusing on streamlining data capture in the field and optimizing in-office planning processes. Our collaborative efforts with industry experts and stakeholders were pivotal in creating a solution that not only integrated disparate data systems but also provided real-time, actionable insights.
Role
Design Lead
Focus
Mobile & Desktop Product Design, Systems Thinking
Skills
UX Research, UI Design, Product Strategy
The Challenge
Transforming Operations for Post-COVID Profitability
With status-quo operations in the energy industry becoming more economically challenging, new efficiencies were needed in order to maintain and exceed profits in a post-COVID world. The standard practice of manually keeping track of outstanding work, digitizing handwritten paper inspections and double-checking data for compliance needed to be rethought to make teams more efficient.
My Role
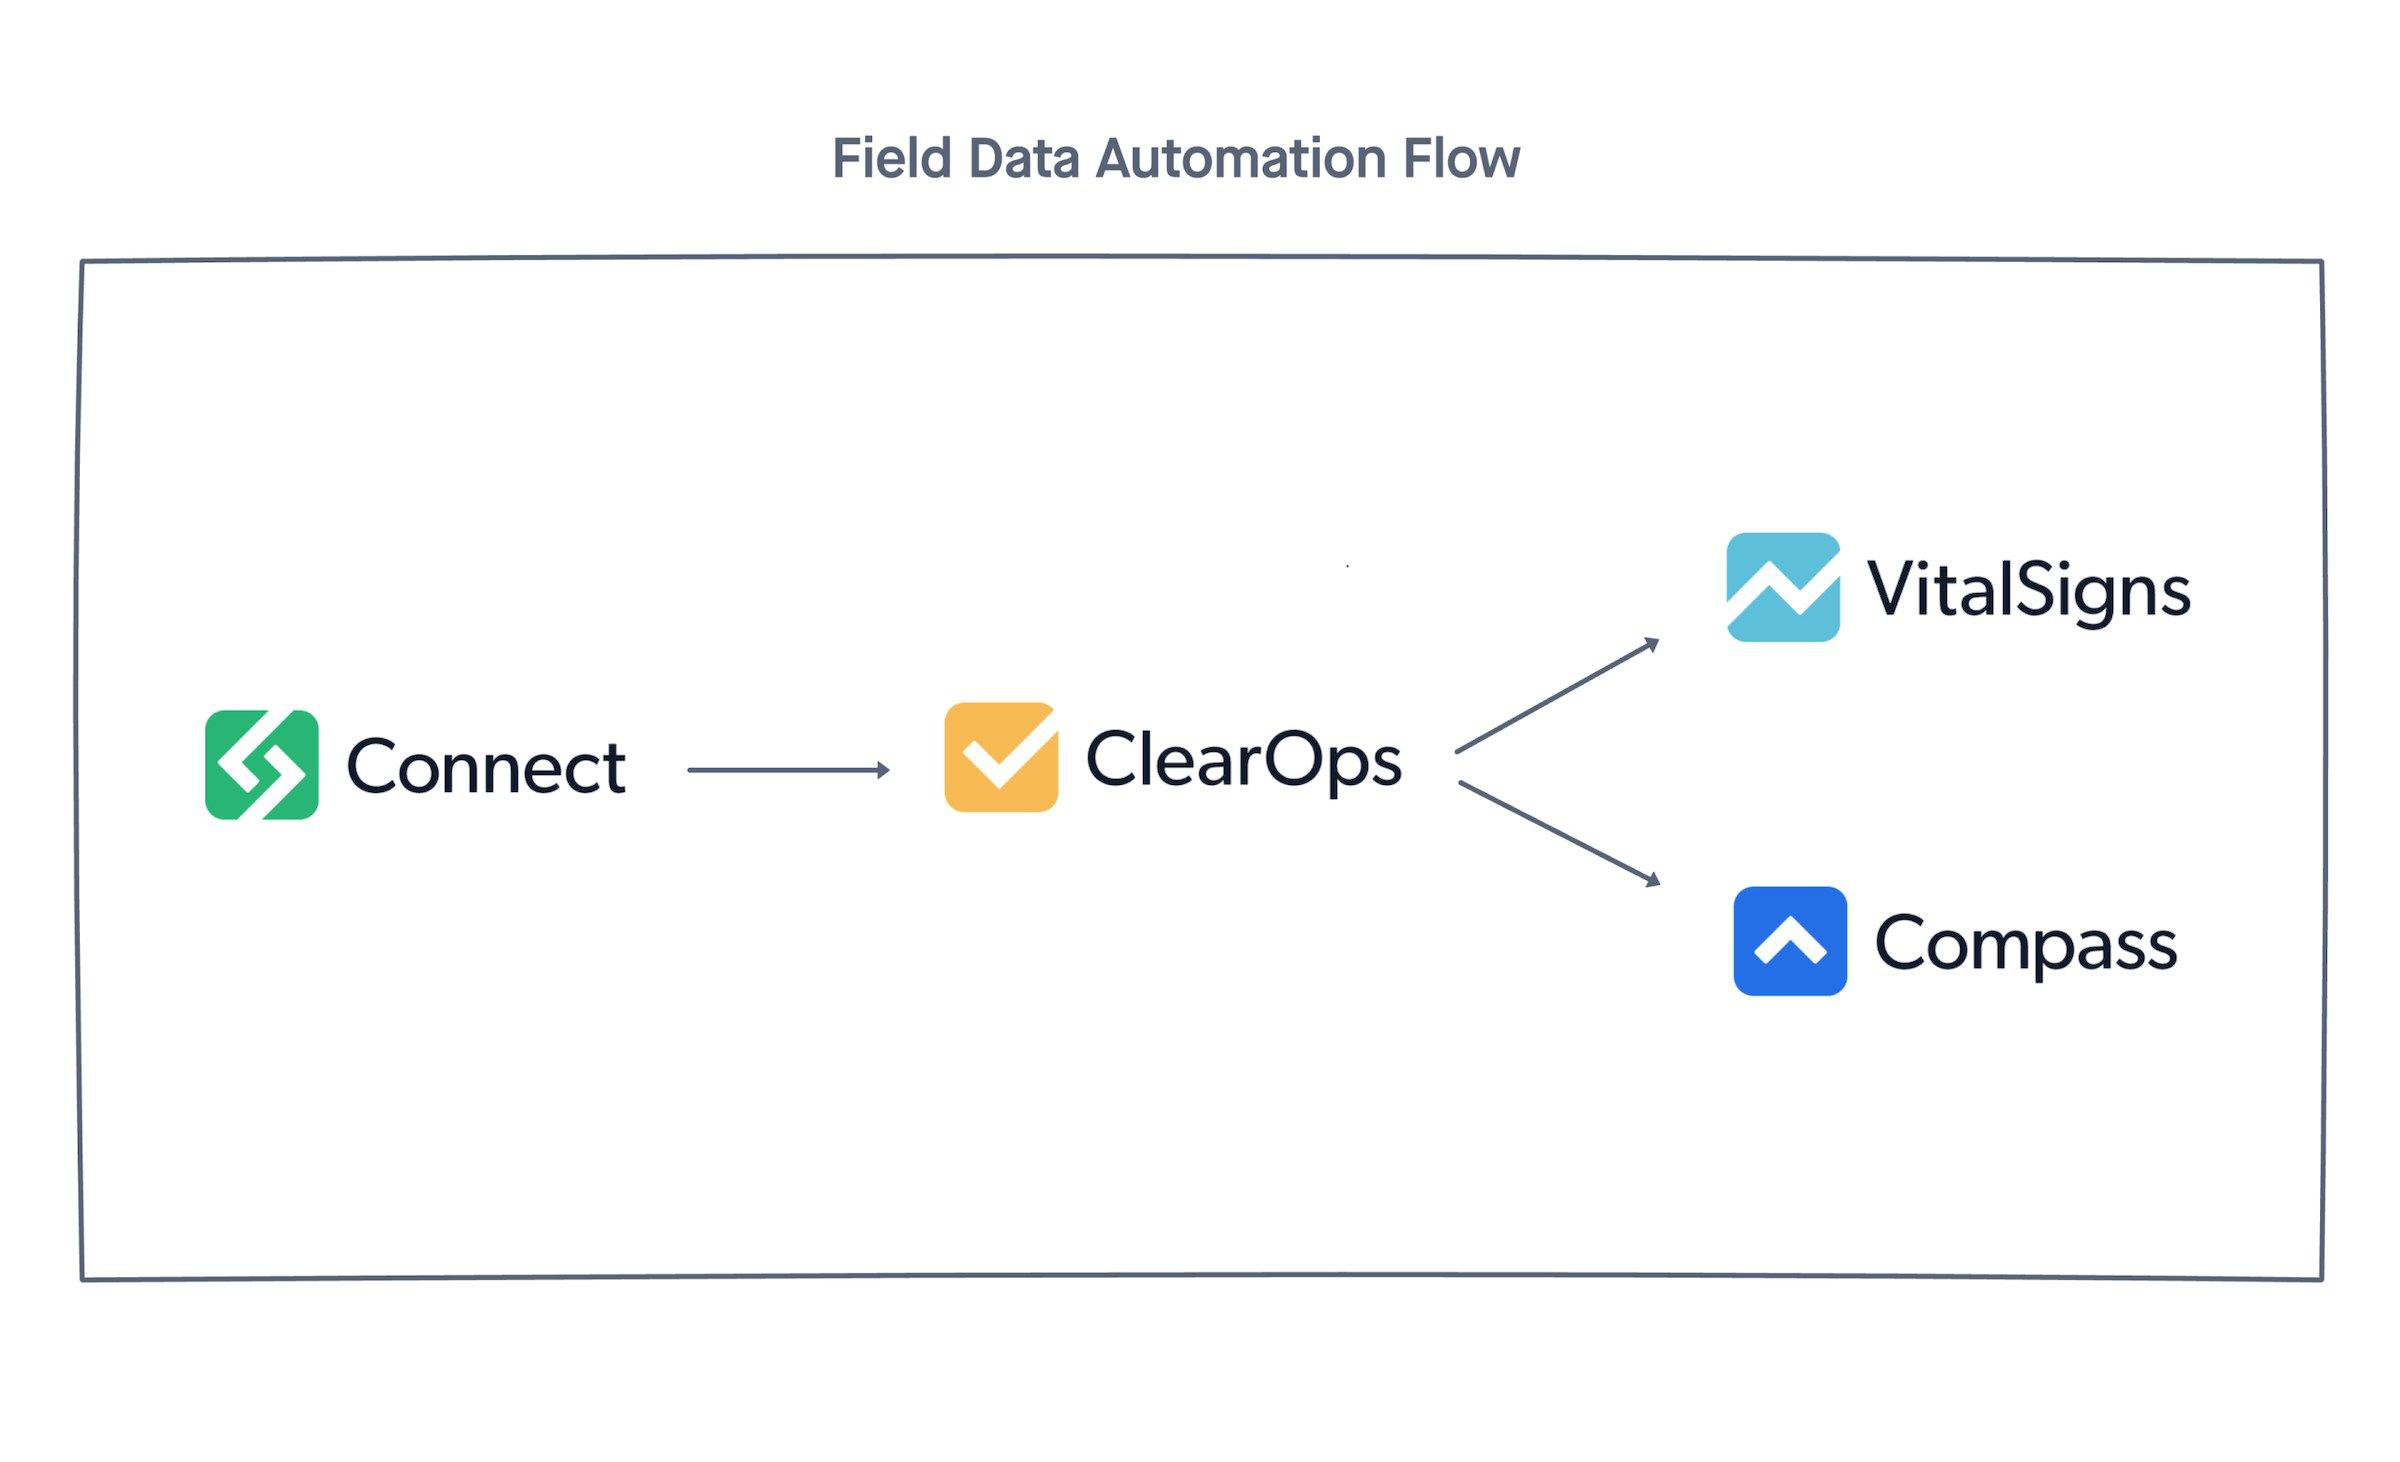
I oversaw and led the design of enSift's product suite – Connect, ClearOps, VitalSigns and Compass. This case study will concentrate on the first two mentioned. Connect for capturing data in the field and ClearOps for scheduling and prioritizing field work from the office. With this in mind, many of the choices discussed extend to all four products.
During the project I collaborated closely with three Product Designers, our CPTO, our Director of Product, a Product Manager, and four Engineers to develop our framework and solution.
Discovery
The Bottom Line
This project was initiated after a conversation with four energy industry experts about the challenges North American energy companies were facing as a result of new policy and the looming COVID-19 global pandemic. We learned that existing software used to track compliance data was either too general, lacking workflows and feedback relevant to the energy industry, or too niche, only useful for specific activities. Little-to-none of these solutions could be integrated with each other, meaning each piece of information collected had to be entered multiple times.
This lack of integration and specialization created significant inefficiencies, leading to increased administrative burden and prevalent errors in data entry. In turn, this led to data being viewed as less trustworthy. The absence of a comprehensive solution hindered the ability of companies to adapt quickly to regulatory changes and respond effectively to the evolving challenges at scale.
To address these issues, we embarked on developing a platform that streamlined compliance tracking, reduced redundant data entry, and provided real-time feedback to help companies stay ahead of regulatory requirements.

Understanding our Users
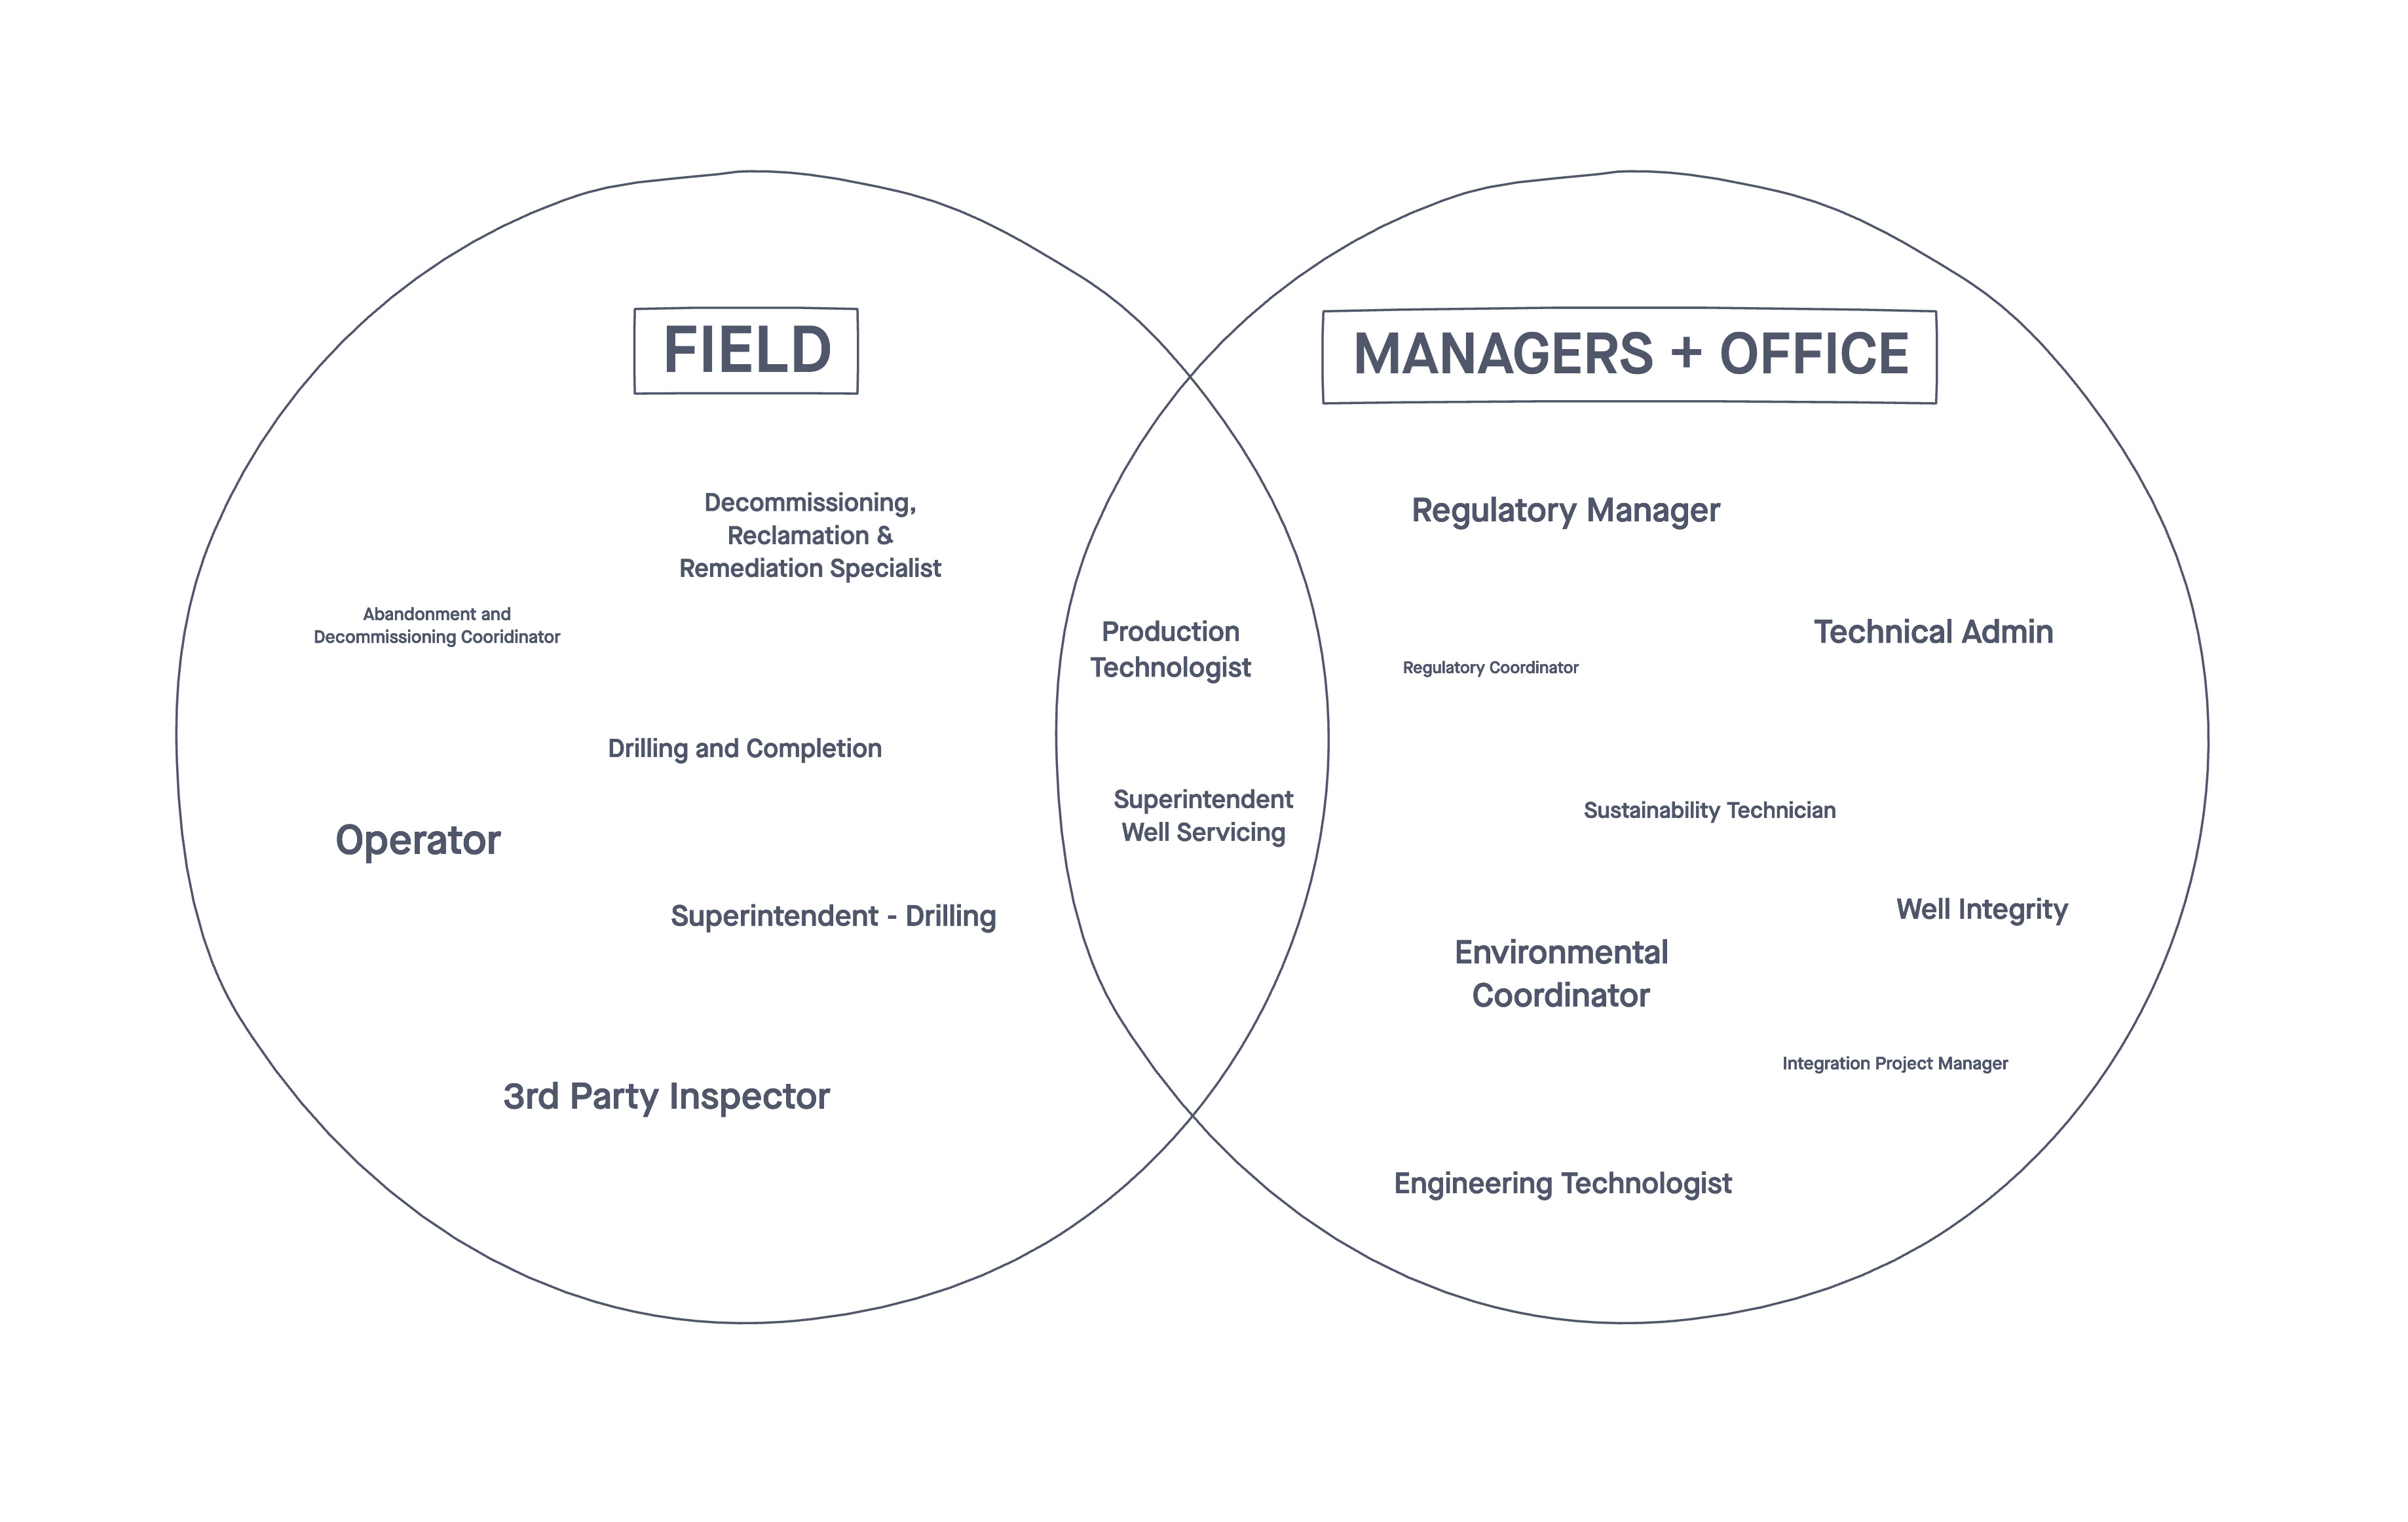
On a mission to build meaningful workflows for all stakeholders, we worked with the experts at our table to identify key roles within the two core groups a new product offering would be meaningful to:
Field Staff
The lifeblood of these companies who are on the ground carrying out inspections, sometimes still with pen and paper, before manually inputting the data into a computer.
Office Staff and Managers
Those who schedule work, prioritize it and make financial decisions. Assessment of liability and risk were top of mind for this group.
As we sought to empathize deeply with our user groups, any expertise that was not found at our table was carefully noted. Meetings were then scheduled to speak with individuals within our innovation-partnered companies who did have the necessary context.
Two Groups, Two Specific Solutions
Widely-agreed, each core group required their own specific solution:
A Targeted Mobile Field Companion
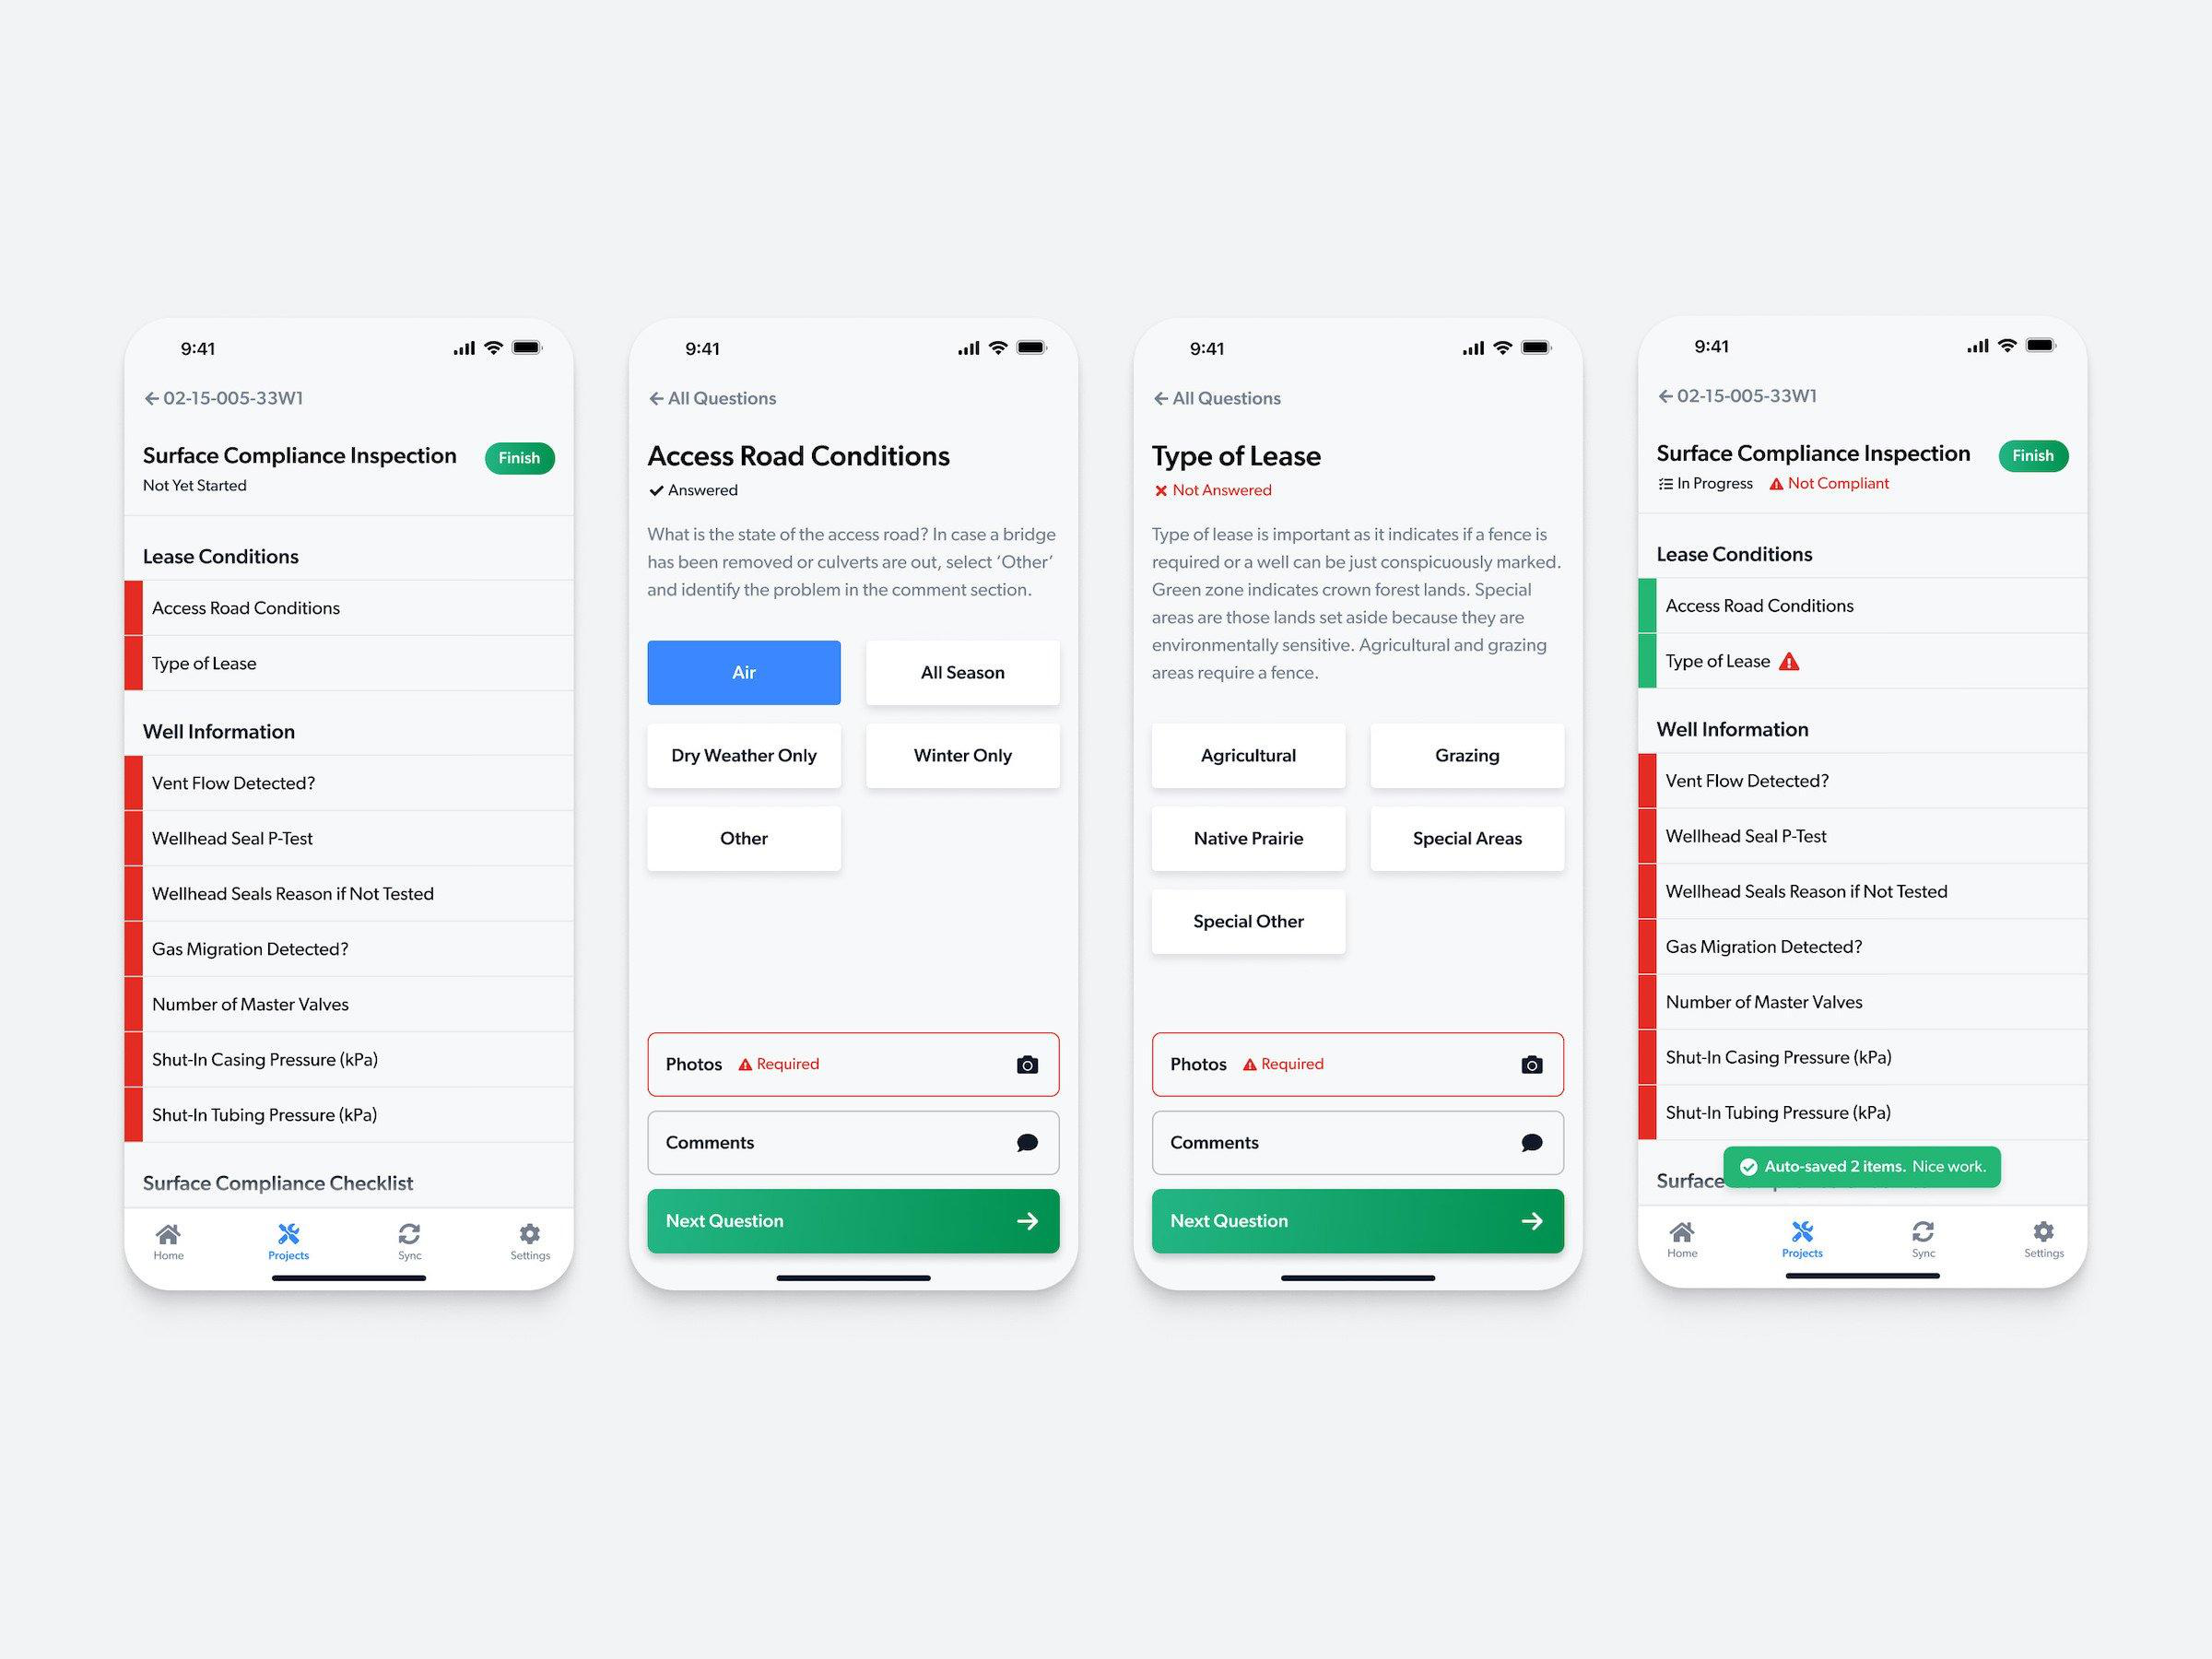
Field Staff needed a companion product that went with them throughout their work day and functioned remotely without an internet connection (many field locations did not have a cellular connection). The solution also needed to consider the gradient of experience field staff had – from experienced engineers and technicians, to folks who were brand new to the workforce, sometimes even without a high-school diploma. We had to ensure the solution was as inclusive as possible.
A Comprehensive Desktop Product
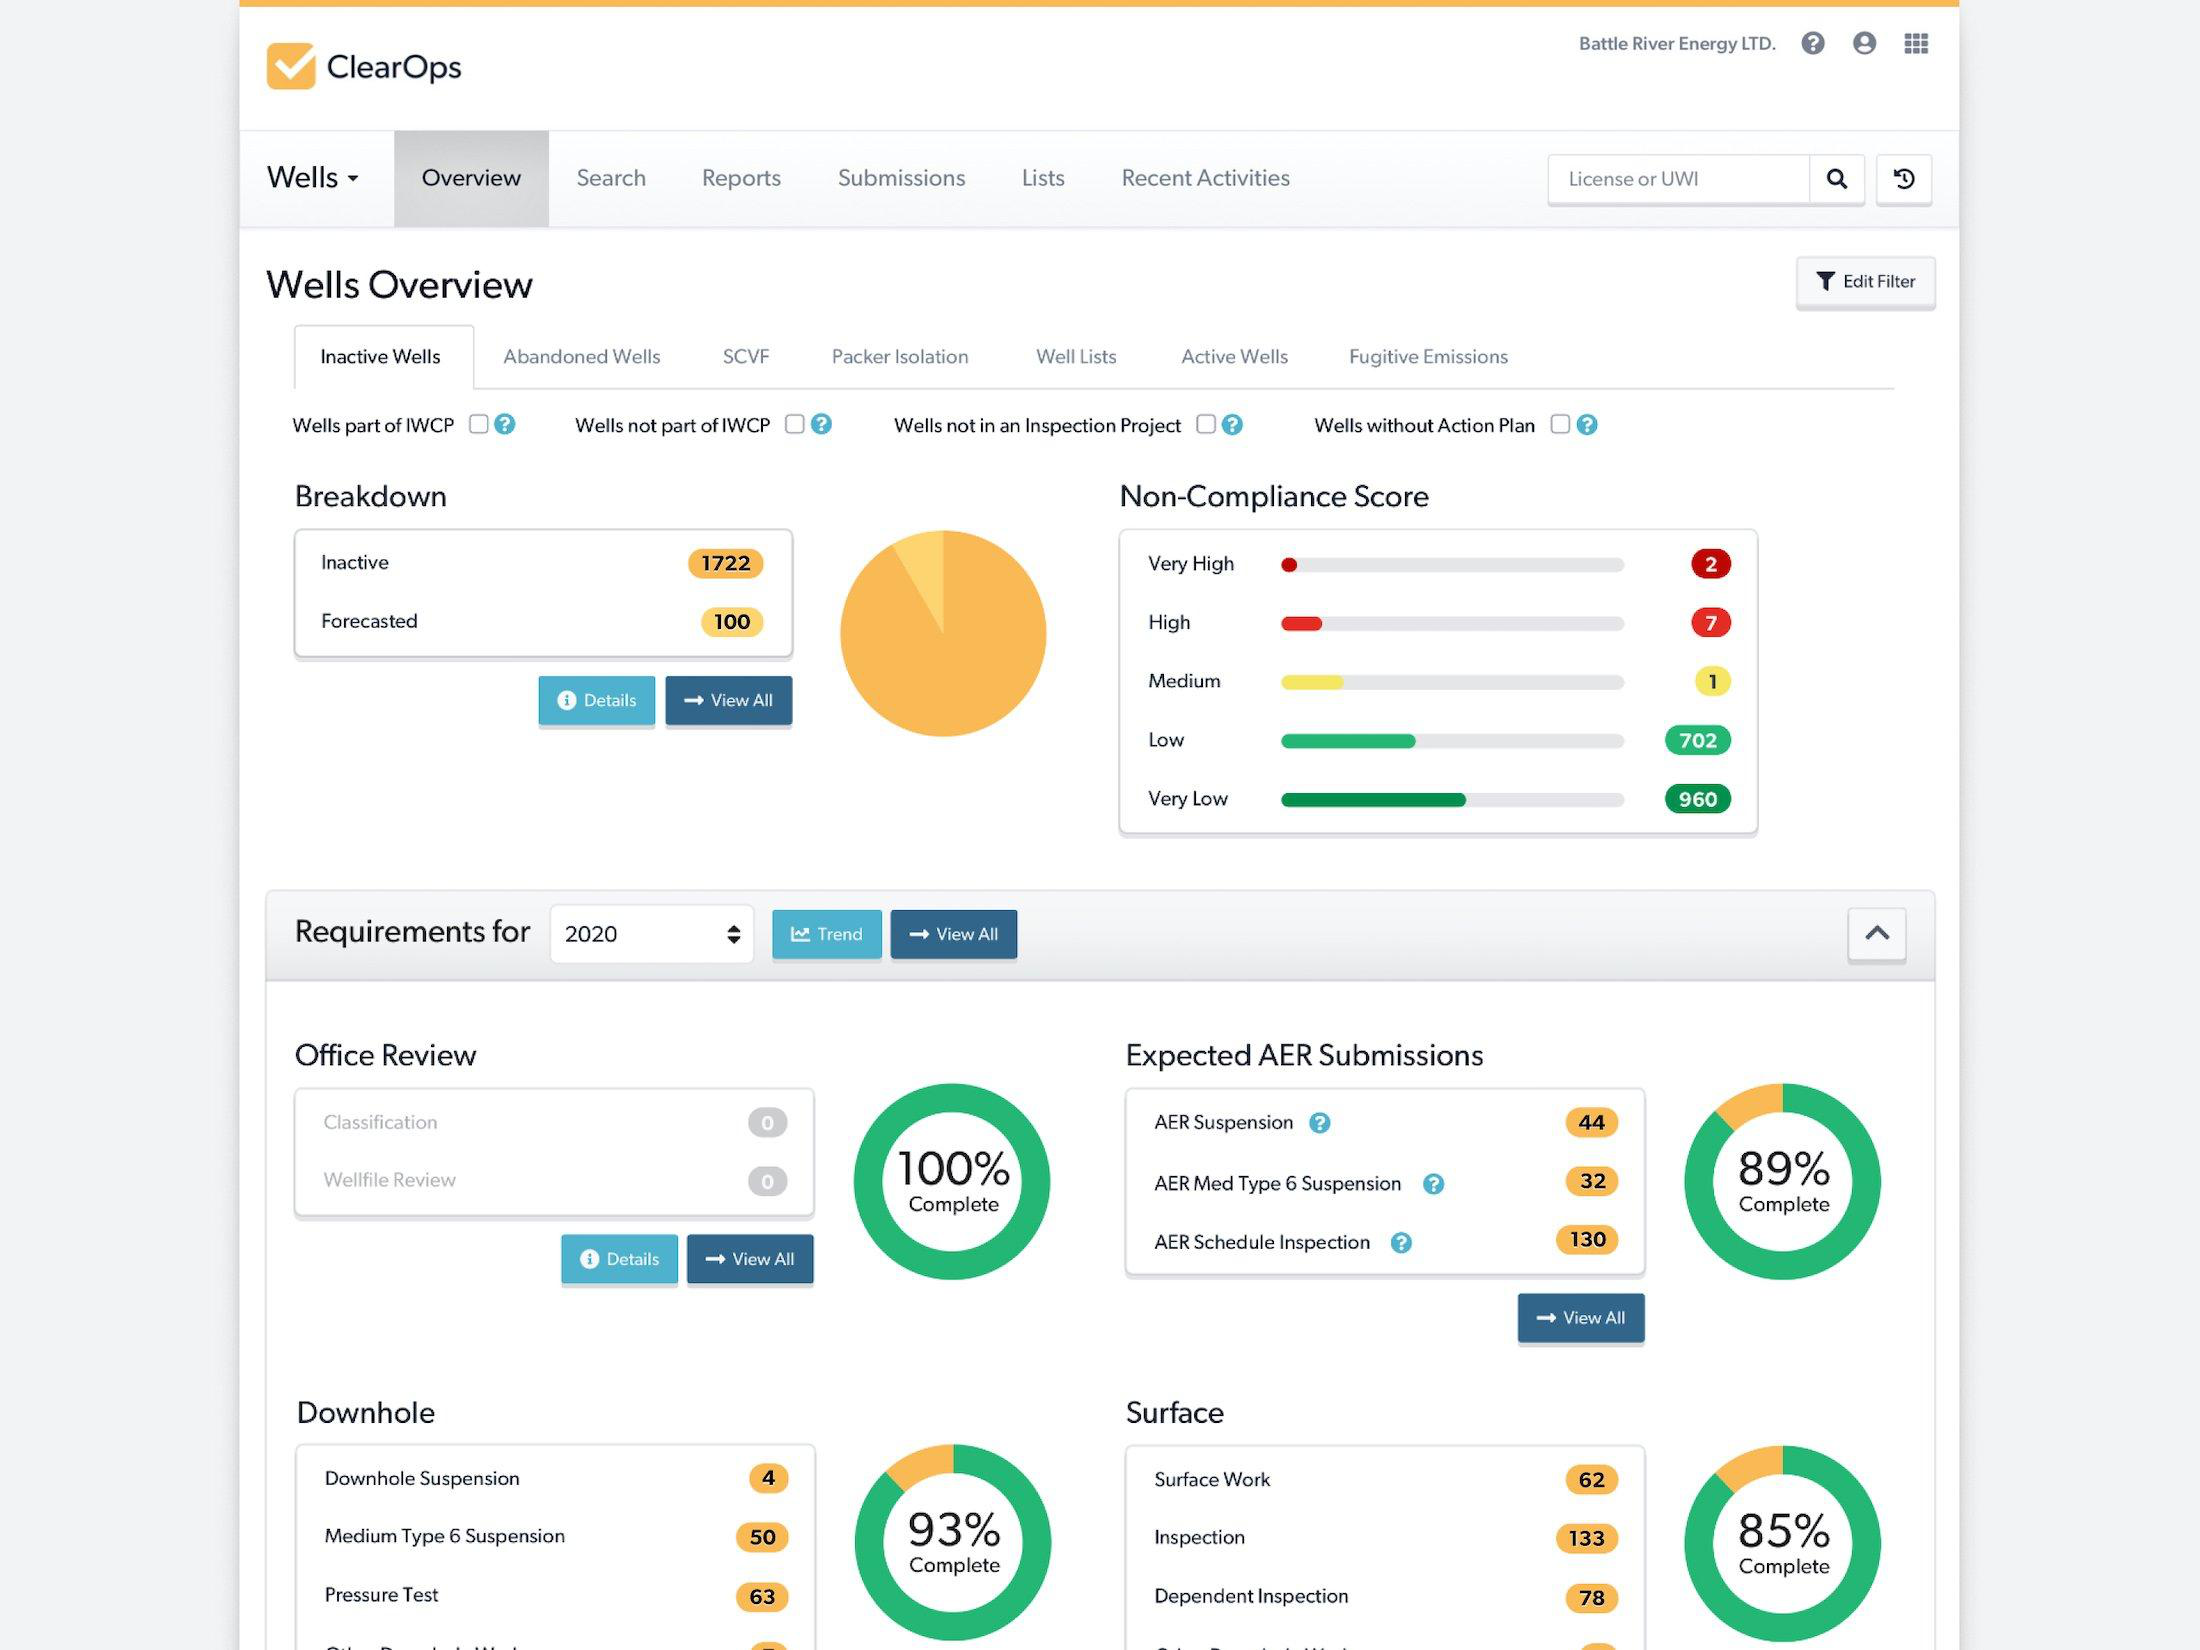
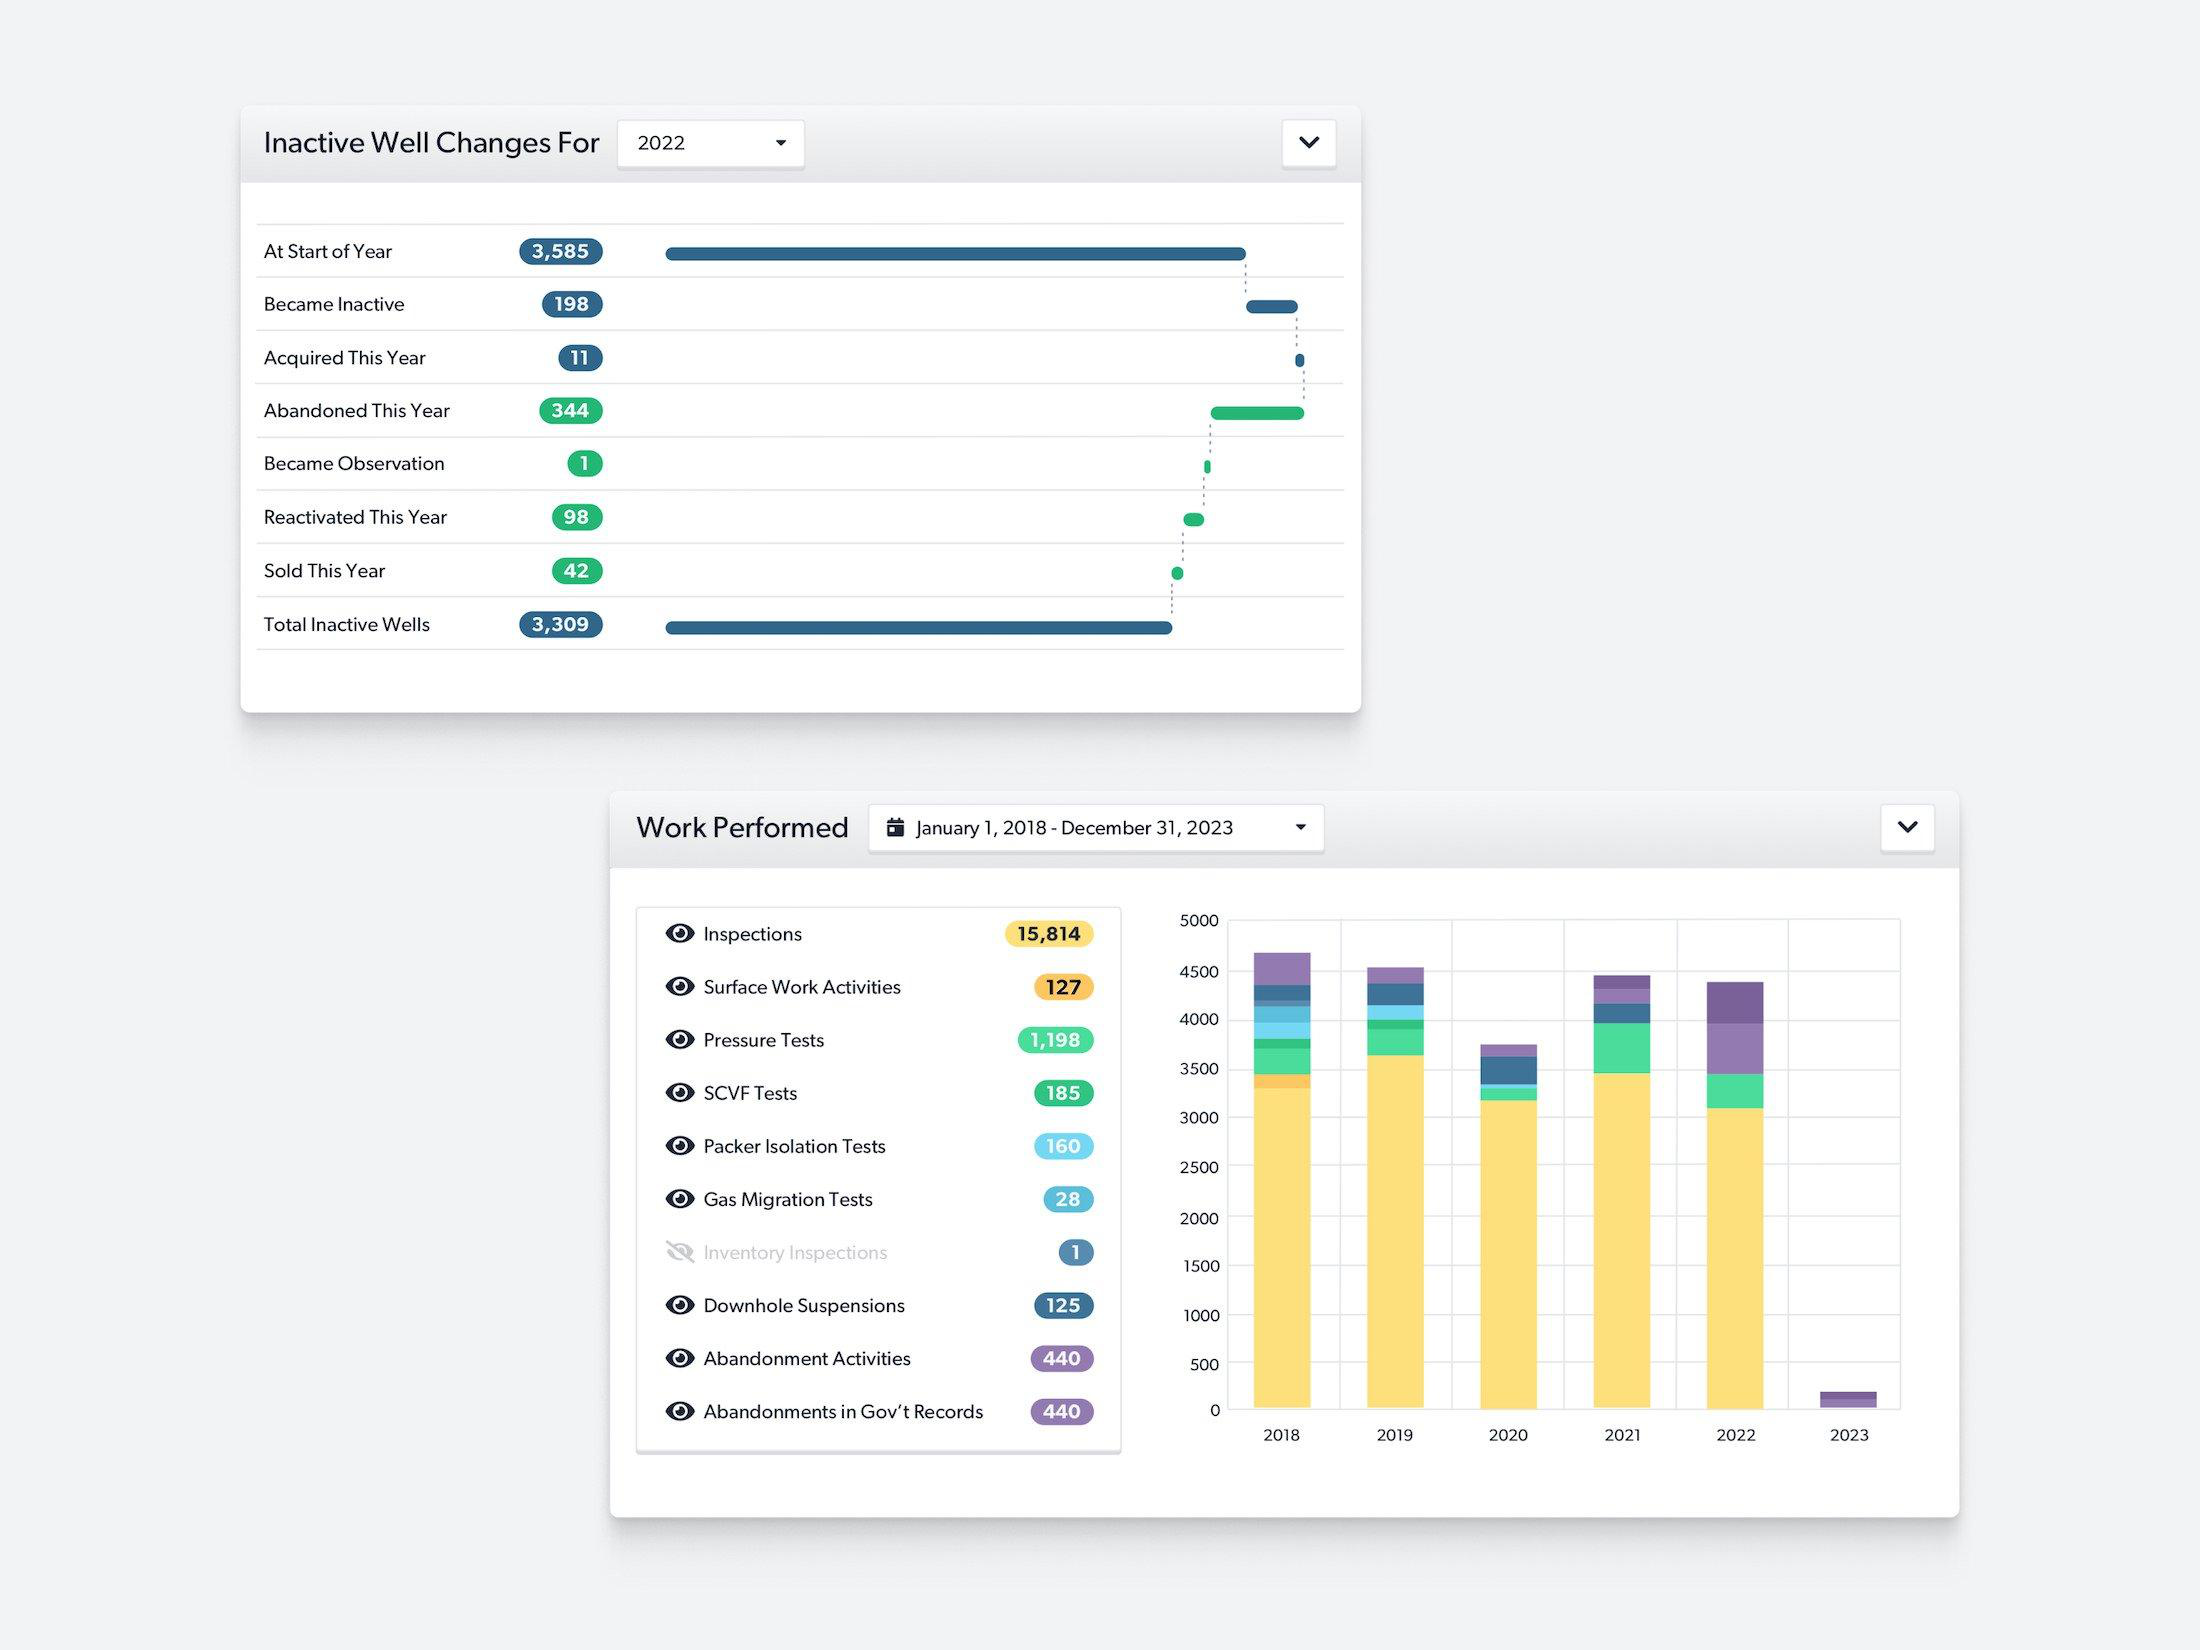
Back at the office, the sheer amount of data that surrounded each of the field inspections was where the largest problem ultimately existed. Teams needed the ability to effectively spot and manage needles in their haystack of data – environmental liability and potential operational risk across tens of thousands, or even hundreds of thousands of assets.
Our discovery findings allowed us to refine our goals even further. Through Connect, ensure that:
- Field staff can work efficiently throughout their day and record data on-the-go with a product that removed the need for pen and paper.
- Double data entry between siloed products was eliminated, reducing human error and improving both the quality and volume of information within the system. This would foster more trust between our two core groups and increase productivity.
- Be inclusive for all experience levels. Provide step-by-step guidance to enable staff of all experience levels to perform inspections effectively and safely.
Through ClearOps, ensure that:
- Evolving industry regulations were consistently and automatically considered, ensuring changes were accessible for office staff to understand.
- In the midst of the current silo'd reality, legacy data was ingested from existing systems wherever possible and incorporated to provide a benchmark for strategy and the user's decision-making process.
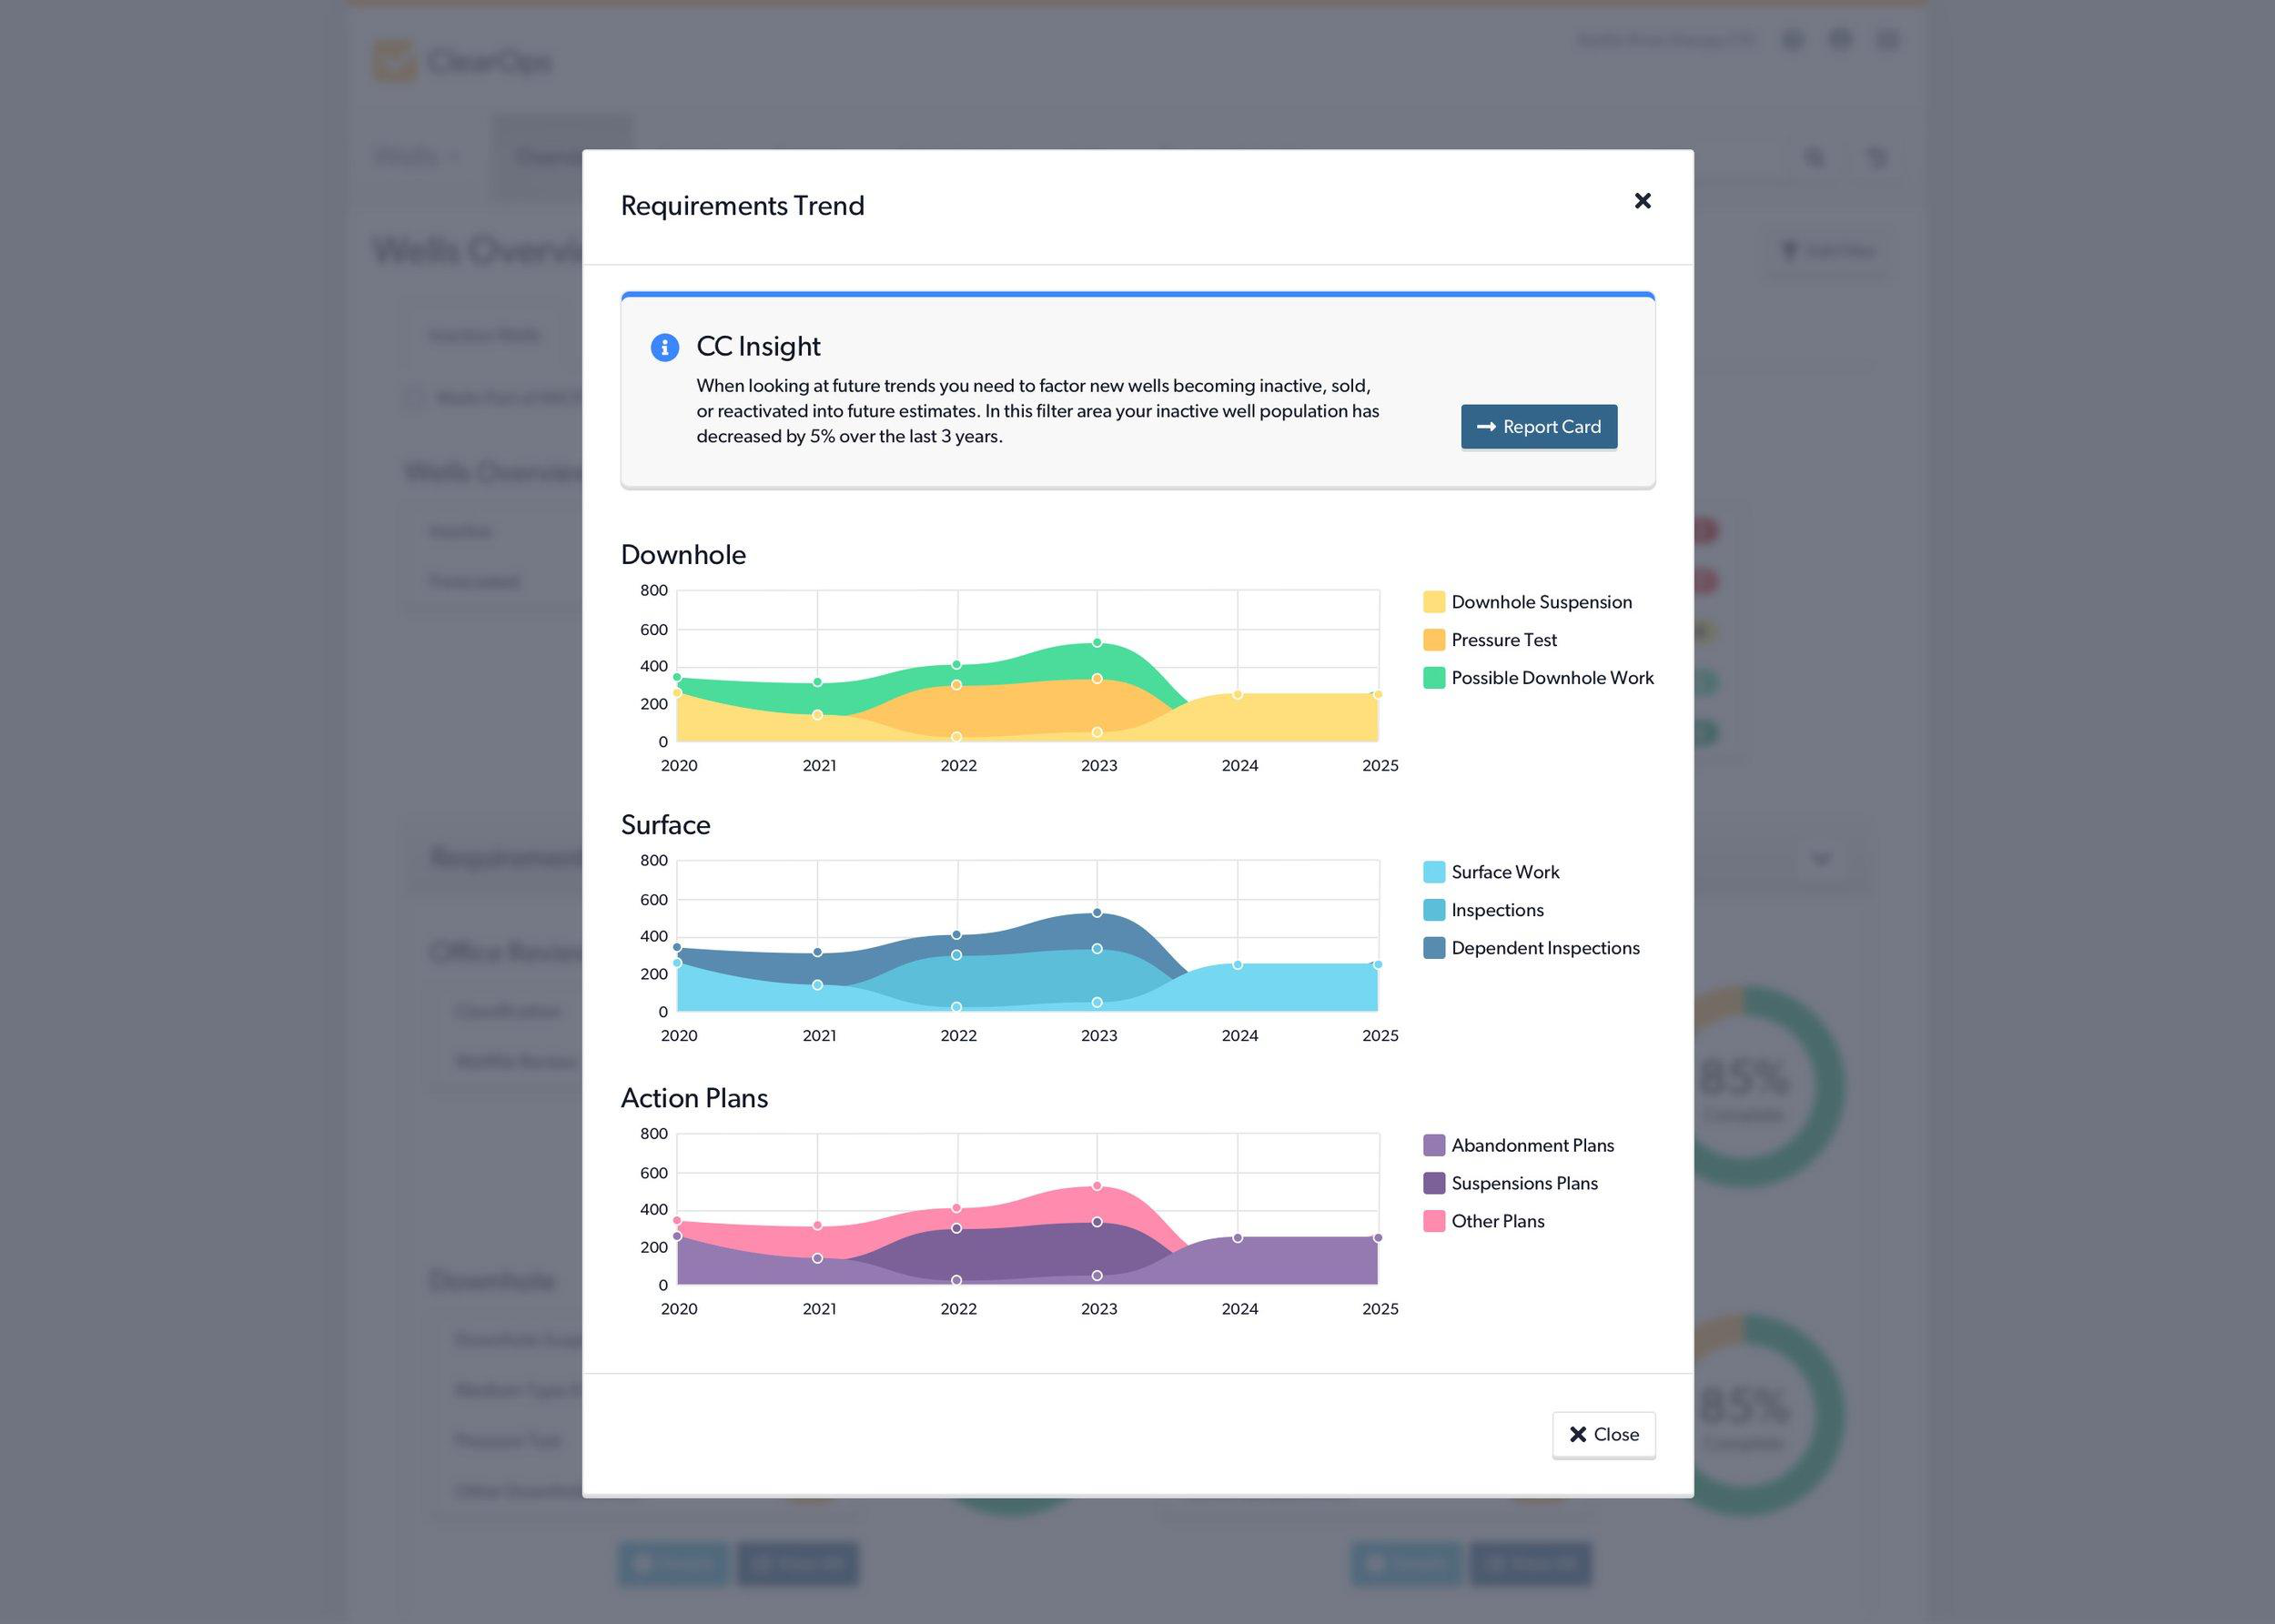
- Both the historical information and new data coming in through Connect would surface insights on choices that could be made to increase profitability and reduce liability.
Process
Constructing the Foundation
Next we combined the deep knowledge of our networks to look closely at the various tools that were currently being used in the industry – IBM Maximo, Wellview, EZ Ops and Excel, among others.
This research allowed us to challenge any preconceived assumptions we might have had, brainstorm better solutions for existing problems and start prototyping improved workflows in low fidelity.
Although we had an idea of how we wanted the end result to look and feel, this stage was purposefully kept as simple as possible so the focus was placed on functionality and the team could be highly iterative, quickly refining ideas along the way.
The Iterative Design Process
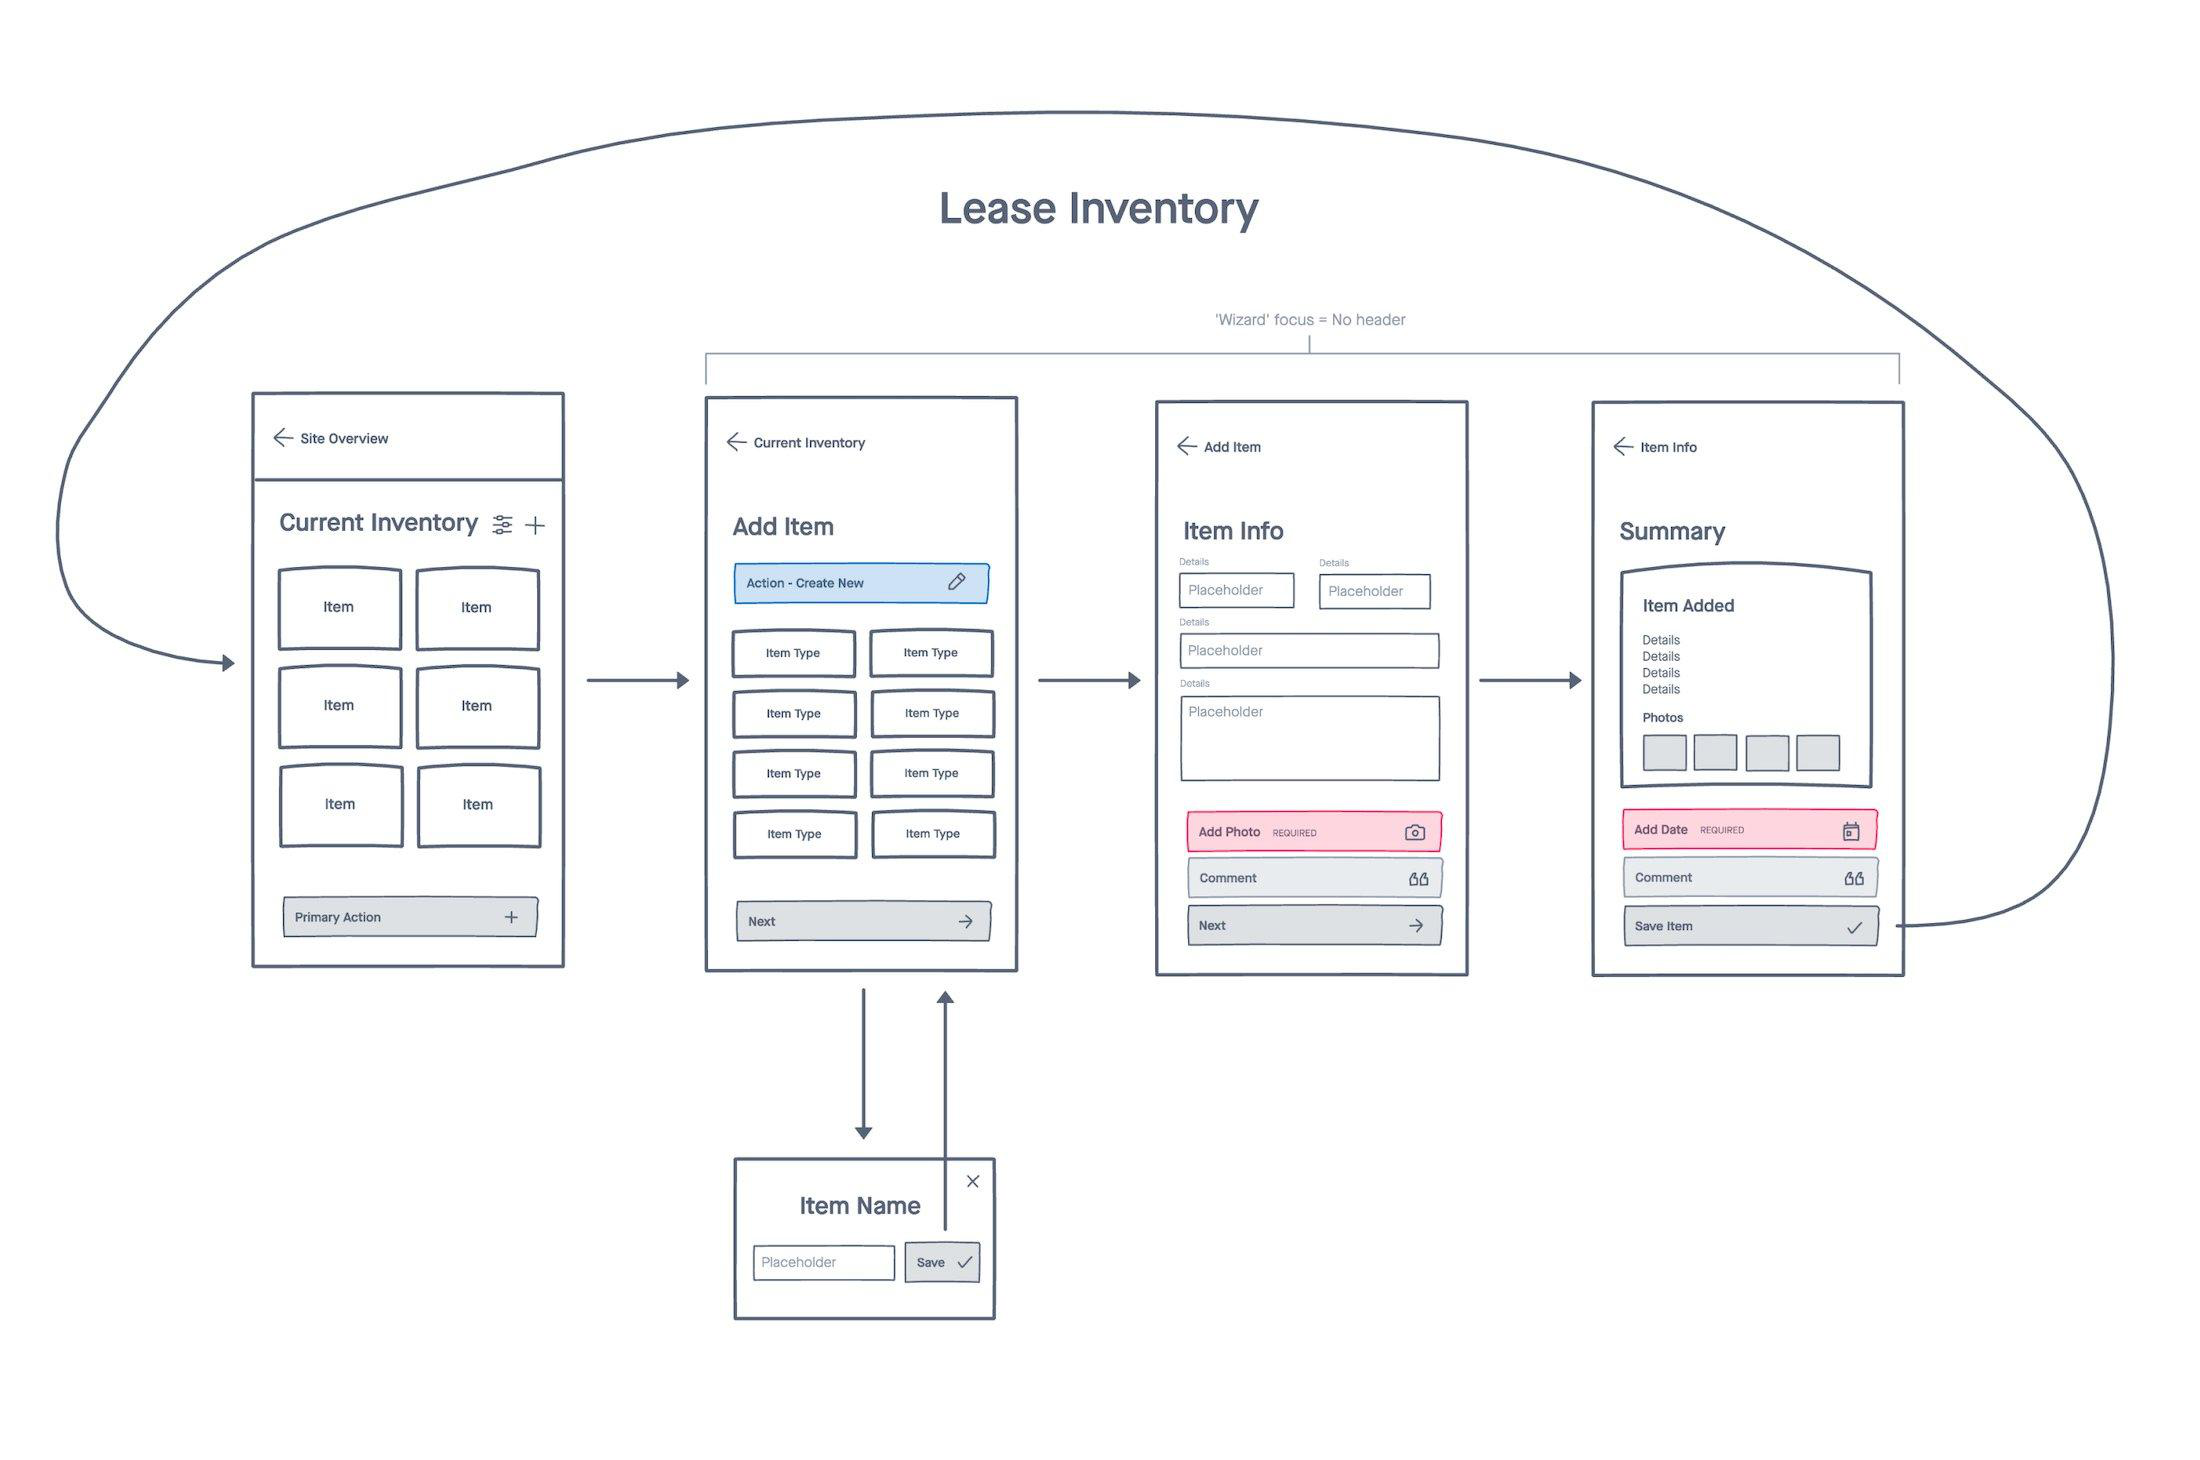
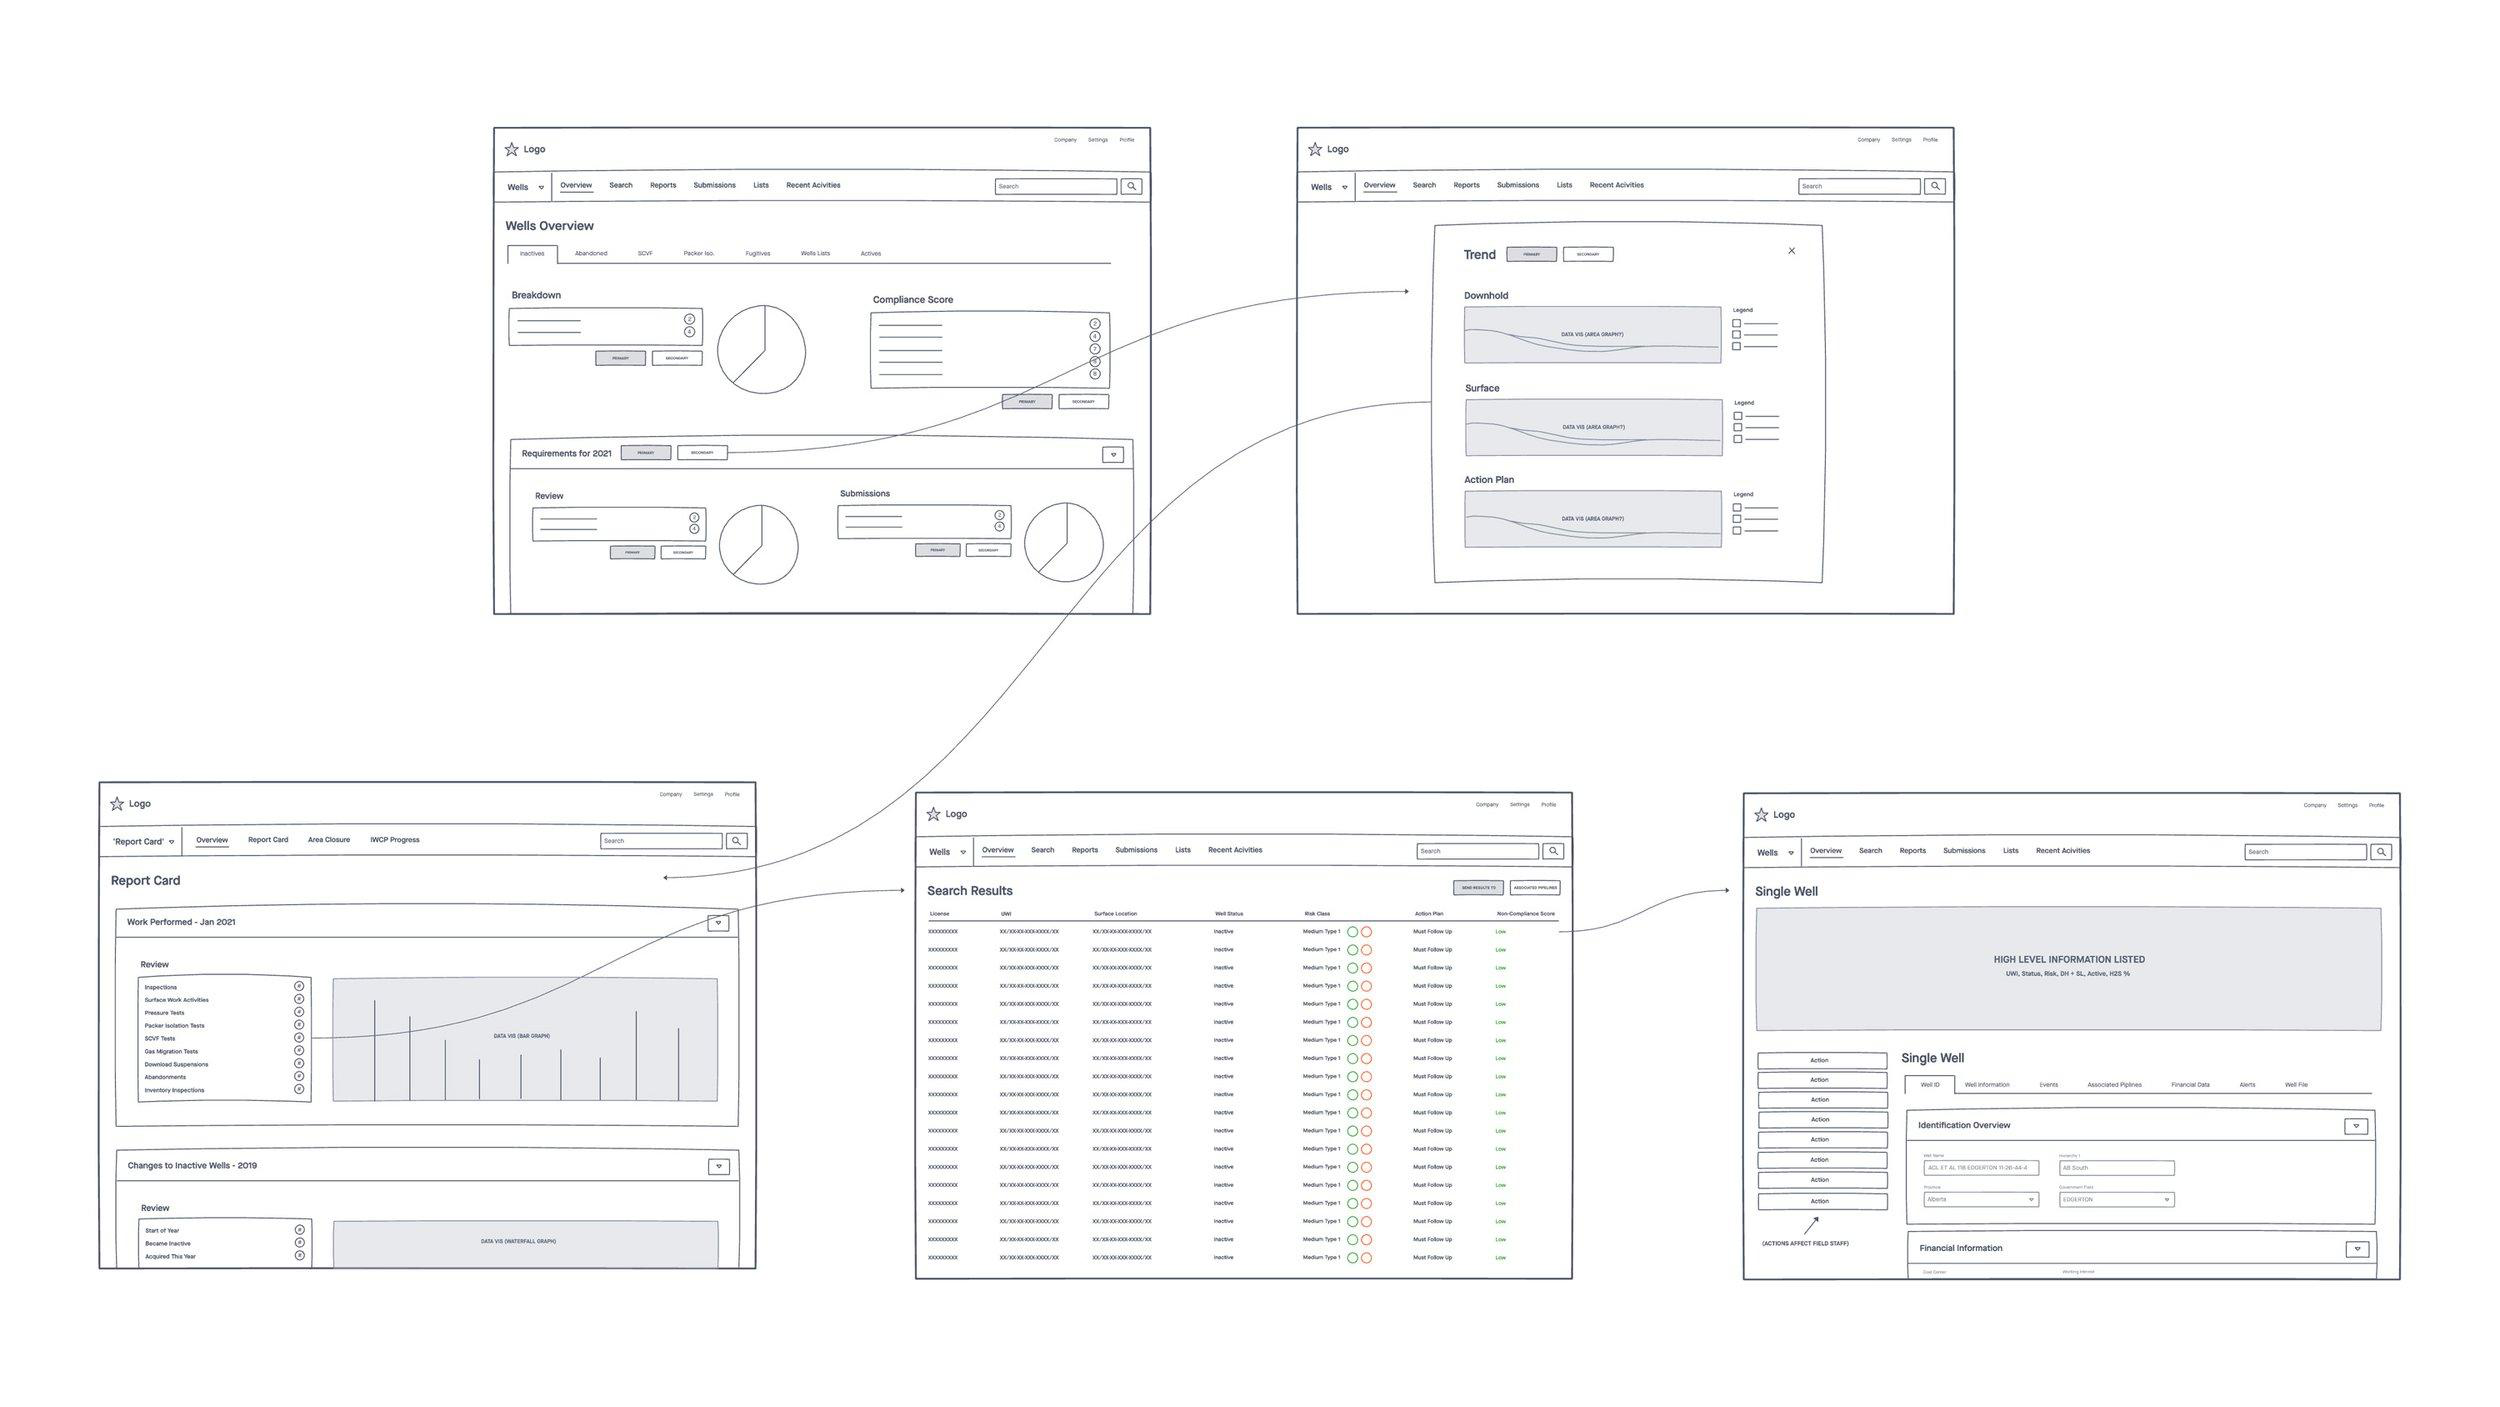
We began with lo-fi mockups to visualize the basic structure and flow. This stage focused on simplifying the user interface, ensuring straightforward navigation, and minimizing the learning curve for new users. Feedback from stakeholders was integral during this phase, allowing us to identify potential issues or oversights early on.
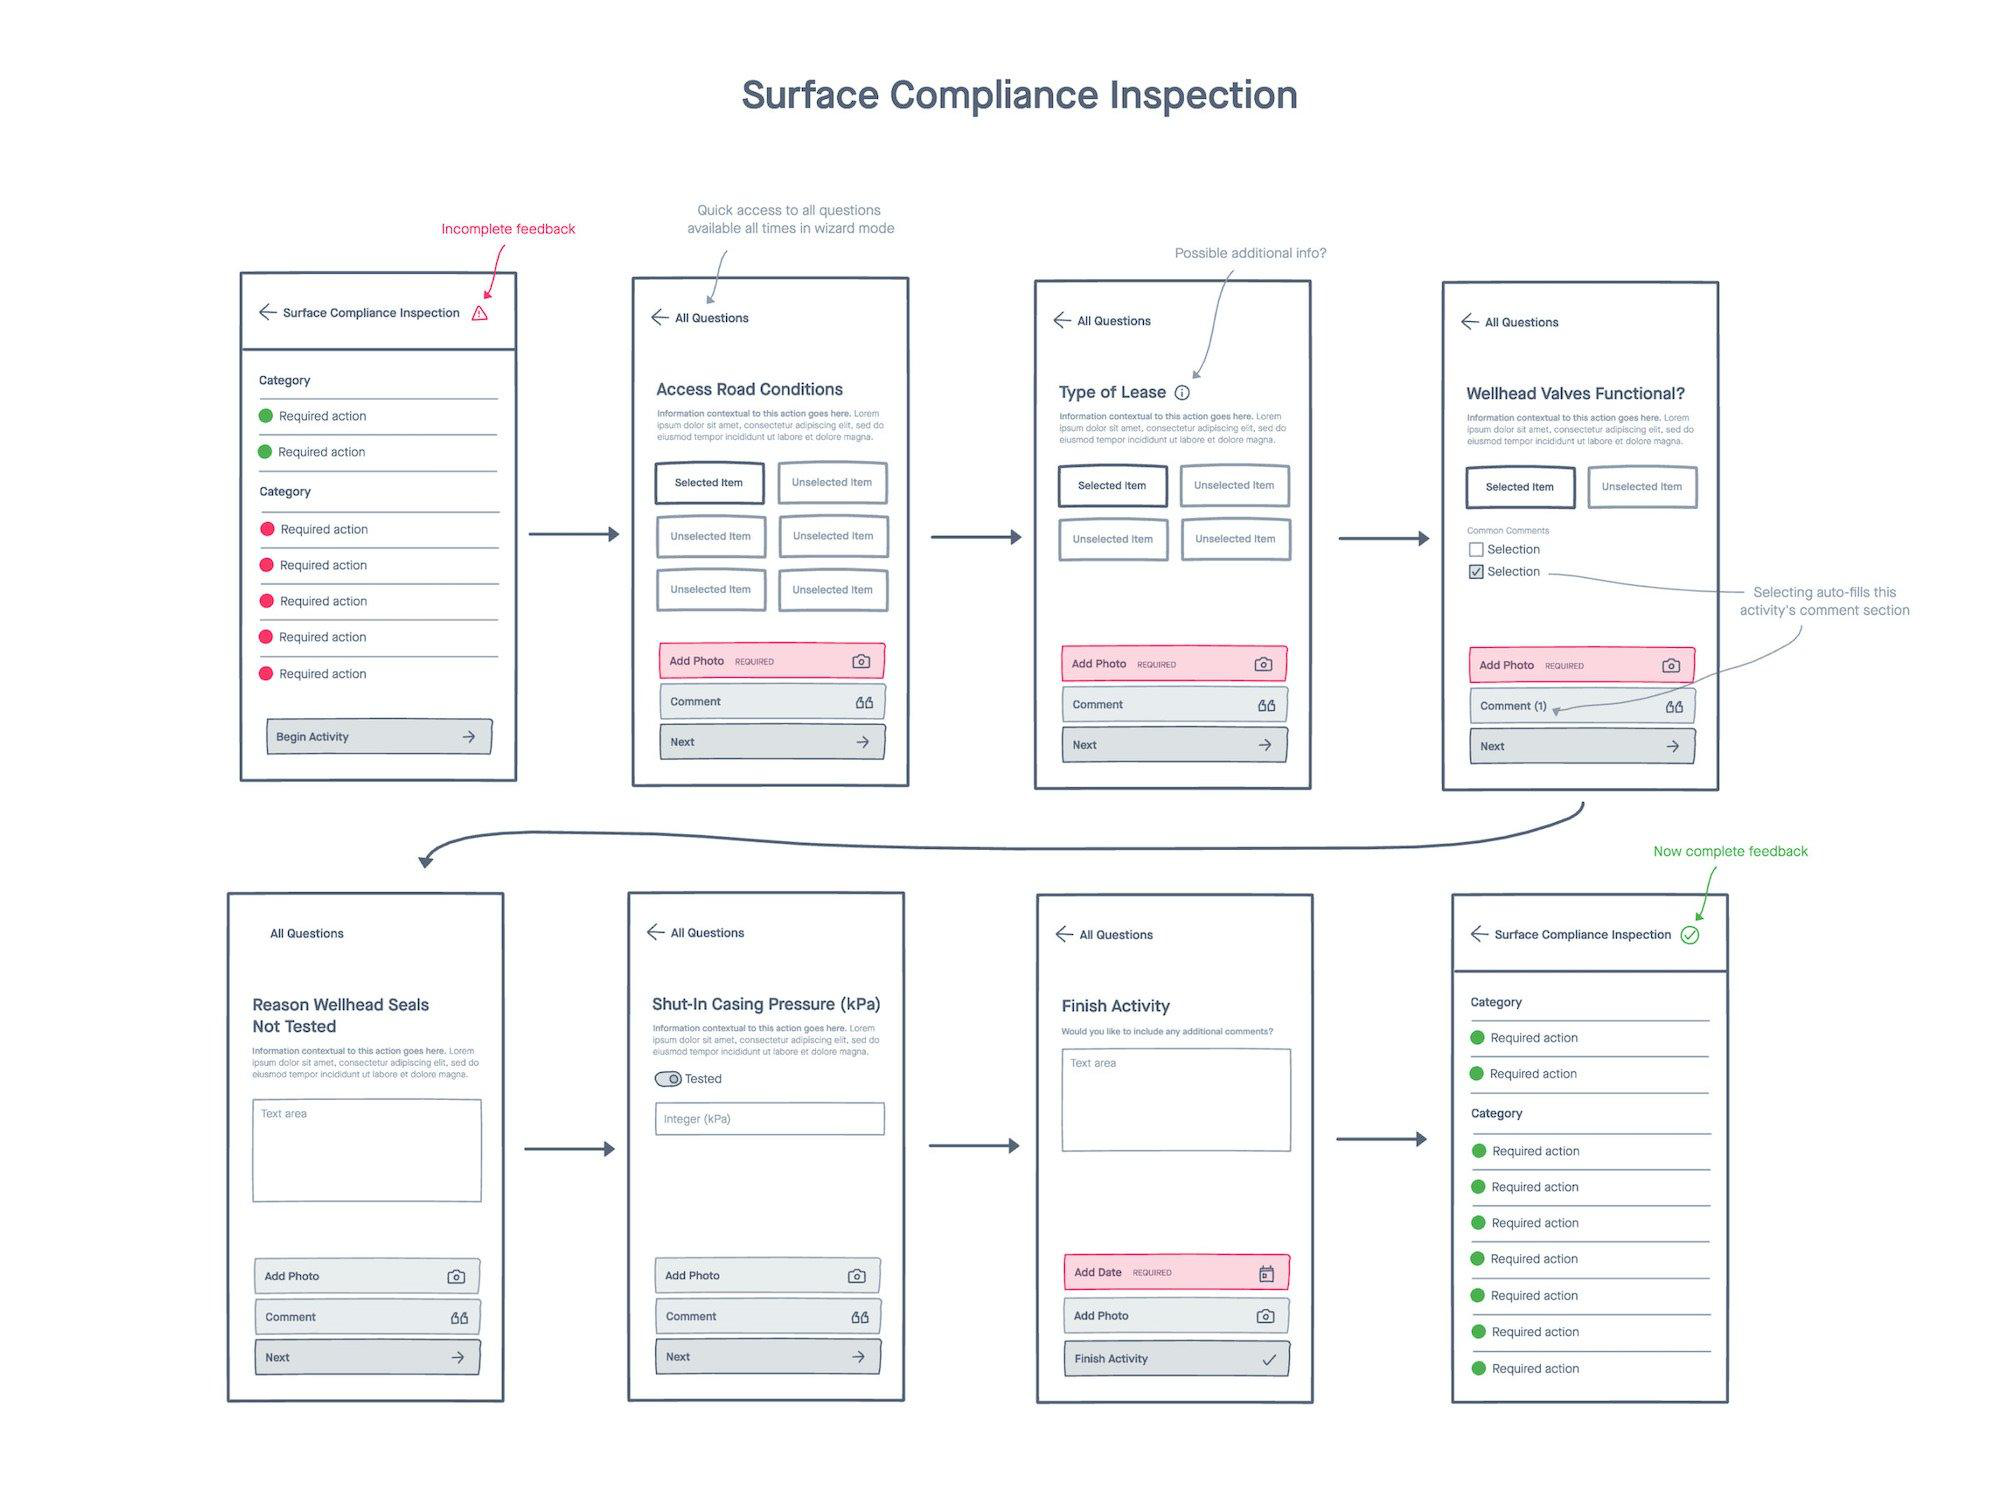
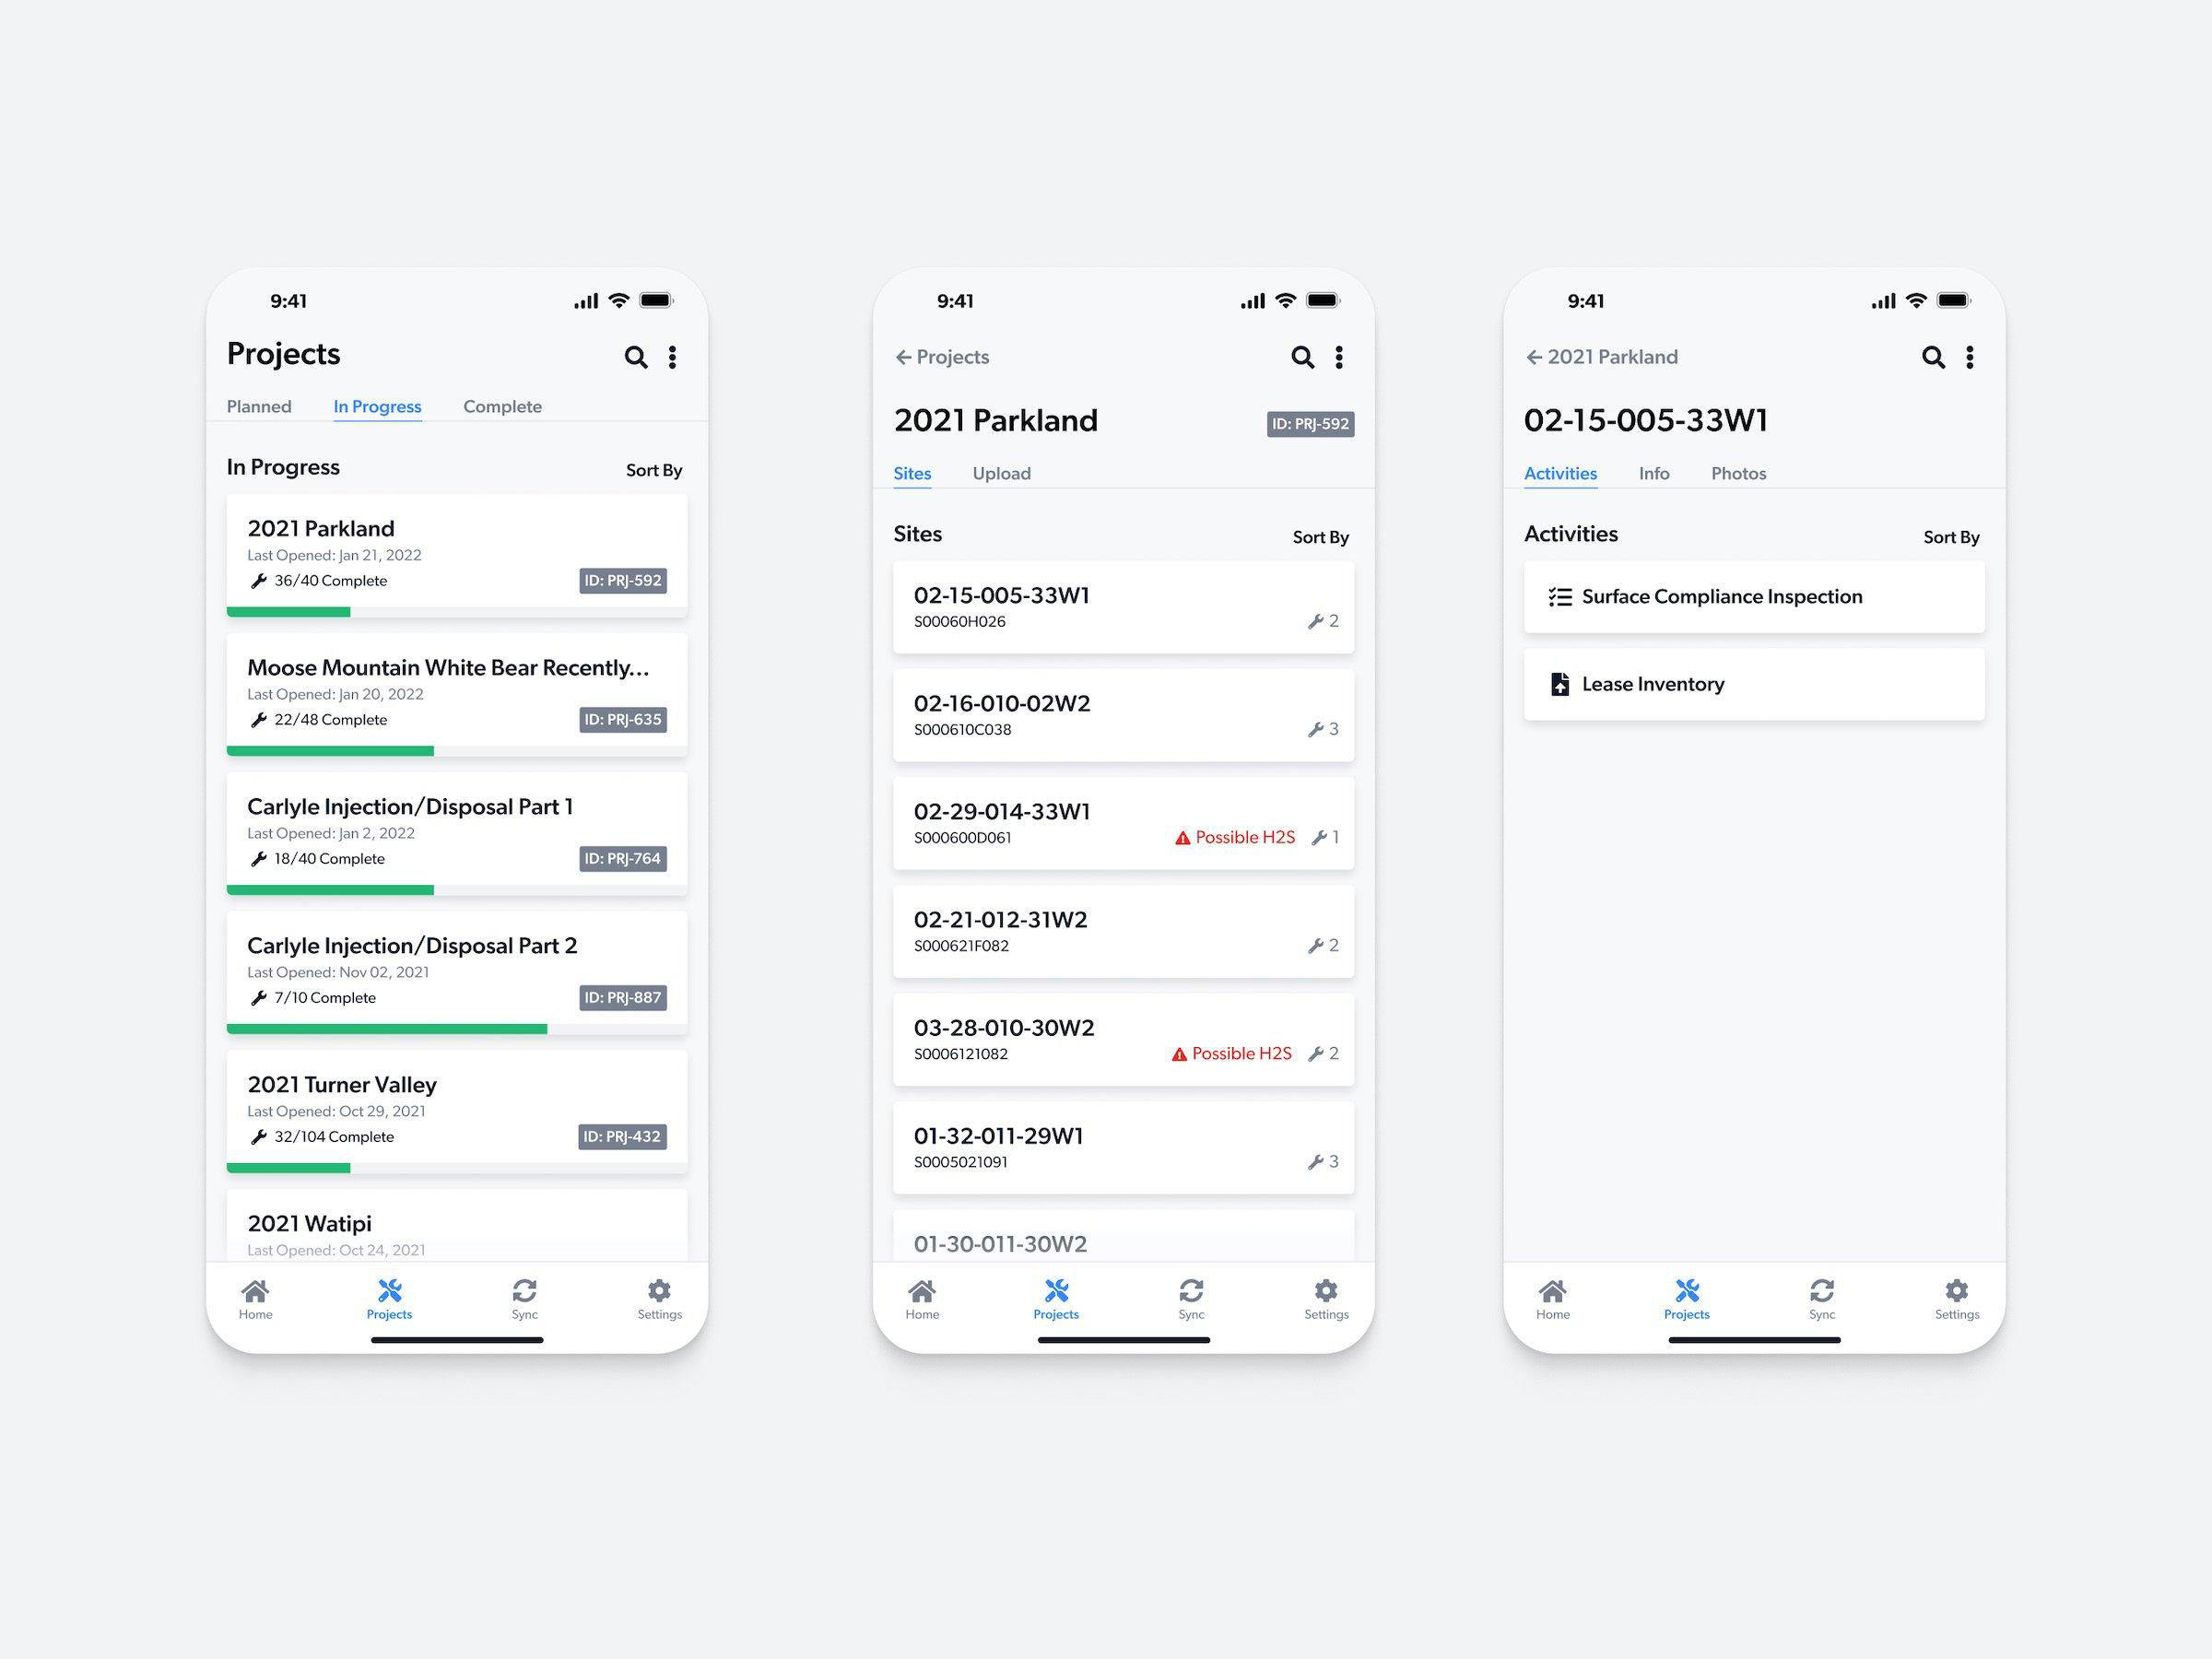
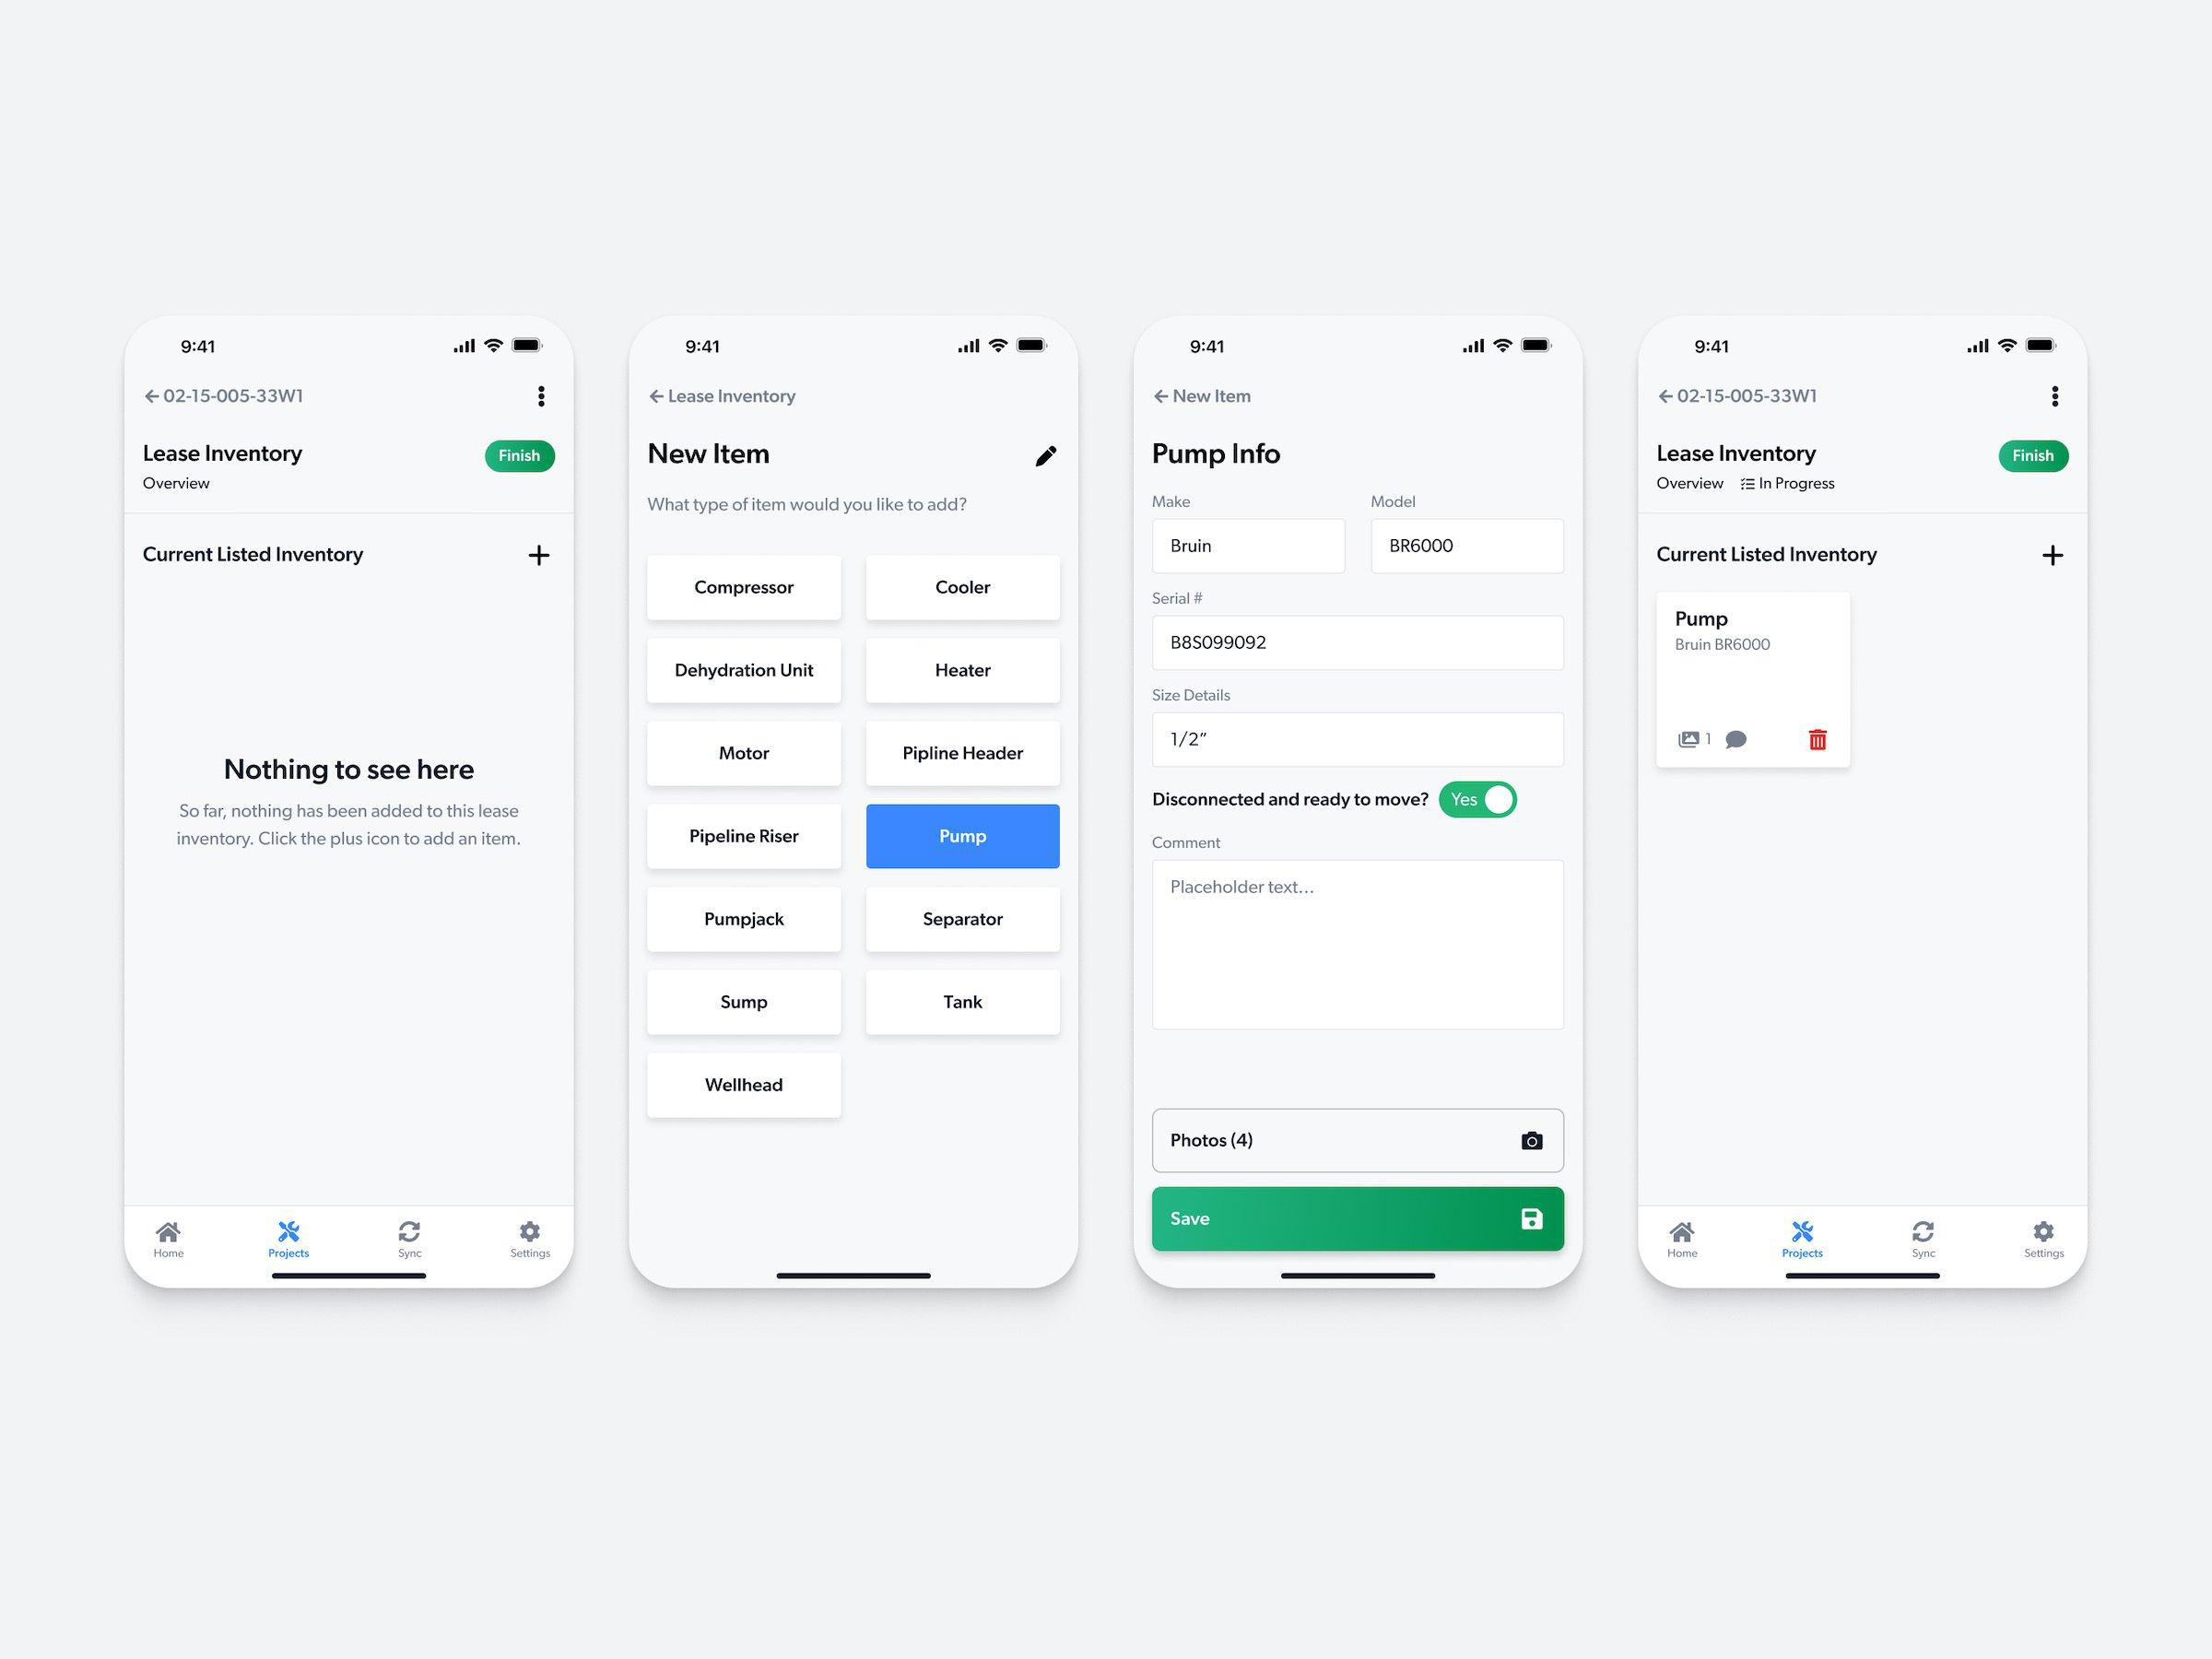
Based on feedback, we soon developed hi-fi mockups and functional prototypes. They featured streamlined, step-by-step guidance, which replaced traditional pen-and-paper methods and eliminated the need for double data entry across siloed systems. Working closely with our stakeholders, we were confident the new approach would significantly improve data accuracy and operational efficiency.
Overcoming Challenges with Diverse Equipment and Inspection Standards
The Problem
As we worked with our stakeholders, we faced an unforeseen and significant hurdle due to the variation of inspection standards across different regions. Field staff used a wide range of equipment, some of which were region-specific or had unique inspection requirements. This diversity posed a unique challenge in designing a universal inspection template that could accommodate all the different standards while maintaining our mandate of simplicity and ease-of-use.
The Solution
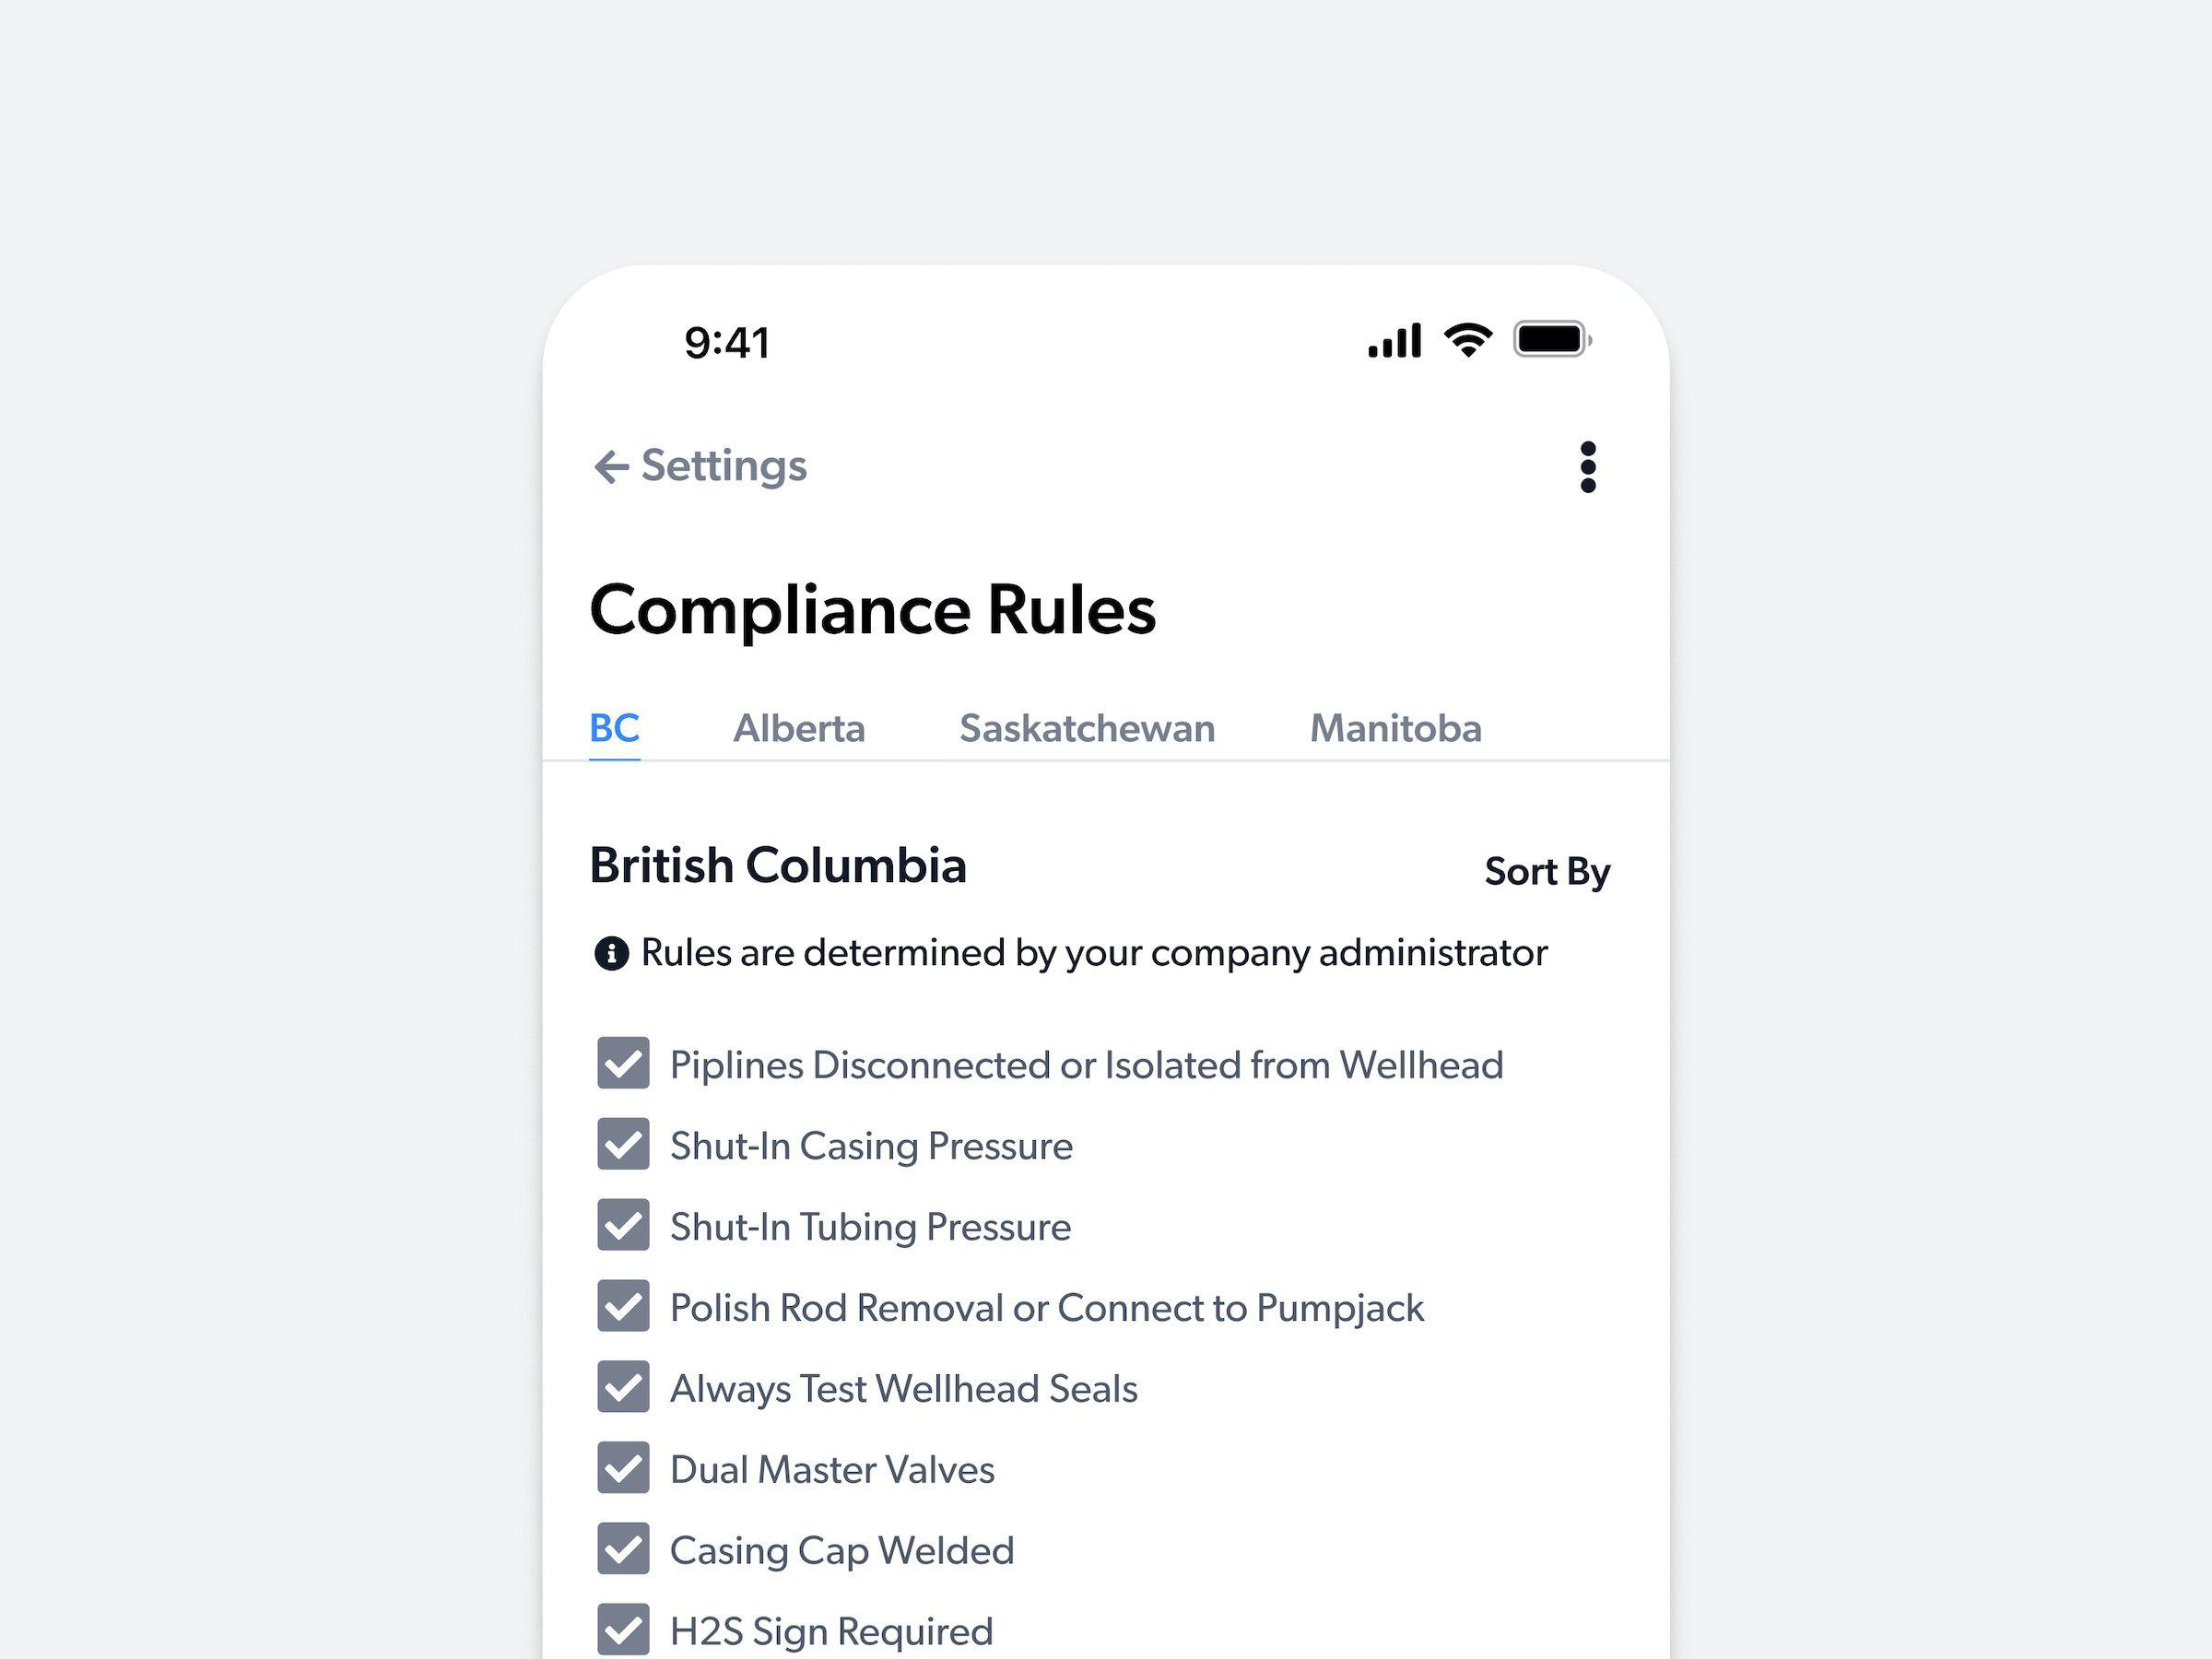
To address this issue, we implemented customizable compliance rules and inspection form features. This allowed users to select and modify forms based on the specific equipment and standards relevant to their region. We included a library of pre-built templates that covered common equipment types and standards, which could be easily adapted or expanded by the users. Additionally, we integrated a form builder tool, enabling users to create and save custom forms tailored to their unique requirements.
We also established a feedback loop with the field teams, allowing them to suggest improvements or additions to the form library. This iterative approach ensured that the product could evolve with the users' needs and that the forms remained relevant and comprehensive.
The Impact
250,000+ field activities and counting, customers have consistently and substantially reduced operating costs, cut emissions and completed more work. The project has been a major success and new features continue to be released. Measurable outcomes:
100%
Productivity Increase
Streamlined workflows, better task management, and enhanced coordination among teams have enabled field technicians to complete twice as many jobs within the same timeframe, contributing to overall efficiency and faster service delivery.
32%
OPEX Reduction
The optimization of scheduling and task allocation has minimized unnecessary expenditures, such as excess fuel consumption and overtime costs, leading to substantial savings for the company.
96%
Environmental Compliance
Customers have achieved an average of 96% compliance with environmental standards and regulations, attributed to the platform's ability to reduce emissions and environmental impact through optimized routing and reduced travel distances. This metric is industry-leading.
65%+
Road Time Reduction
An unexpected benefit of enhanced visibility and planning capabilities. More on this below.
“Before we were typically doing 4 inspections a day per inspector. We now are able to complete 8. ClearOps and Connect have doubled our productivity.”
– Field Supervisor
“With Connect the risk of errors have gone way down now that everything is done automatically and in real time.”
– Production Technologist
“I have my nights back with my family now that I no longer have to manually enter all my inspection data. It's done automatically in the field with Connect.”
– Abandonment and Decommissioning Coordinator
** For confidentiality reasons I have omitted the actual names for these testimonials.
Unexpected Results
Road Time Reduced by Over 65%
Sometimes a solution you build is used in ways that you didn't expect – this project has a really exceptional story with this in mind.
Customers using Connect and ClearOps have gained the unexpected benefit of a 65% road time reduction. What does this mean? Before using the products, they scheduled work based on geographical proximity as best they could but it was more of a rough exercise. Technicians headed out to the field would still miss work that existed nearby their assignments for the day. Sometimes that work had a 3+ hour travel time attached and the nearby work could take as little as fifteen minutes.
Connect and ClearOps have enhanced visibility and planning capabilities giving teams a new level of visibility for scheduling work more effectively. This optimization has not only saved time but also reduced fuel costs and wear on vehicles, contributing to a lower carbon footprint, aligning with sustainability goals.
Want to see more of my work?
View All Projects